About the Fibonacci Forex Scalper System
The Fibonacci Forex Scalper system for MT5 is a technical tool that automates the identification of key market levels using Fibonacci mathematical ratios.
It identifies two specific support and two resistance zones on the price chart, creating a clear framework for high-frequency trading.
By focusing on breakout momentum at these levels, the system helps traders find precise entry points and profit targets without manual drawing.
It is particularly effective for those who want to capitalize on short-term price expansions in volatile markets.
Free Download
Key Features
- Automatically calculates and displays two support and two resistance Fibonacci levels.
- Uses color-coded lines to distinguish between trade entry triggers and exit targets.
- Provides a simplified approach to scalping by removing complex manual analysis.
- Visual layout is optimized for rapid decision-making on lower timeframes like M1 and M5.
- Works efficiently across all financial instruments, including major pairs and gold.
Indicator Chart
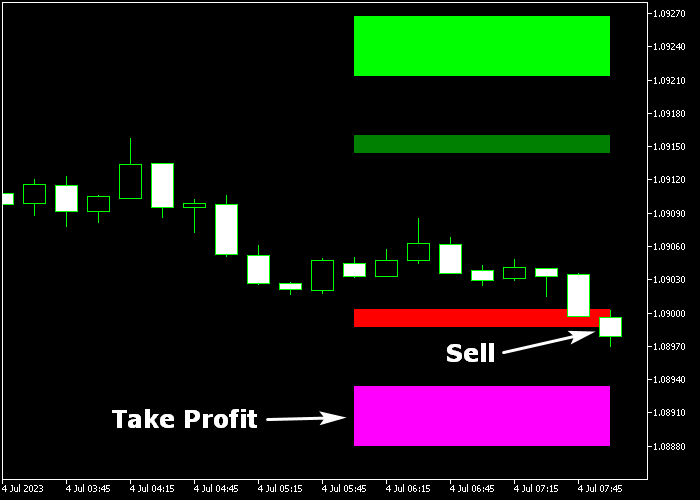
The chart shows the Fibonacci Forex Scalper system projecting horizontal green, lime, red, and magenta lines across the price action.
You can see how these levels act as boundaries that trigger trades upon contact.
The visual separation between the entry lines and target lines provides a clear roadmap for executing quick intraday transactions.

Guide to Trade with the Fibonacci Forex Scalper System
Buy Rules
- Execute a buy market order as soon as the price touches the green Fibonacci resistance level from below.
- Ensure the candle is showing strong upward momentum to confirm a valid breakout attempt.
- Verify the signal during the London or New York sessions for better follow-through toward the target.
- Hold the long position until the price action reaches the secondary lime-colored exit level.
Sell Rules
- Initiate a sell market order when the price touches the red Fibonacci support level from above.
- Check that the market environment is bearish to support the downward move toward the target.
- Confirm the entry trigger on a closed candle to avoid reacting to temporary price wicks.
- Maintain the short bias until the candle makes contact with the magenta take profit level.
Stop Loss
- Position your protective stop loss just below the nearest support zone for all buy trades.
- Place a defensive stop loss above the immediate resistance level for sell market orders.
Take Profit
- Close the buy trade immediately when the candle touches the lime-colored Fibonacci resistance level.
- Exit the sell trade as soon as the price action makes contact with the magenta support level.
- Consider securing partial gains if the price stalls before reaching the primary target line.
- Manual exits are recommended if a new opposite signal forms before the target is achieved.
Fibonacci EMA Scalping Strategy for MT5
This scalping strategy combines key intraday support and resistance with trend filtering using the Fibonacci Forex Scalper System and the Exponential Moving Average (EMA) Indicator.
It is designed to catch quick reversals off important Fibonacci levels while making sure trades align with the prevailing trend direction.
The Fibonacci Forex Scalper System plots dynamic levels that act as short-term targets.
When price touches a green Fibonacci resistance level from below, it signals a potential buy.
When price touches a red Fibonacci support level from above, it signals a potential sell.
These levels adapt to recent price action, giving a more responsive reference than static horizontal lines.
The EMA Indicator adds trend direction by coloring the moving average line.
A blue EMA line indicates bullish conditions, while an orange EMA line shows bearish conditions.
Aligning Fibonacci touches with trend direction increases the probability of successful scalps.
This method works well on M1 and M5 charts, particularly during high-volume sessions like London and New York.
Buy Entry Rules
- Wait for price to touch the green Fibonacci resistance level from below.
- Confirm that the EMA line is blue.
- Enter a buy trade at the close of the touch candle.
- Place the stop loss below the recent consolidation or EMA line.
- Close the trade when price reaches the next Fibonacci level or when the EMA line turns orange.
Sell Entry Rules
- Wait for price to touch the red Fibonacci support level from above.
- Confirm that the EMA line is orange.
- Enter a sell trade at the close of the touch candle.
- Place the stop loss above the recent consolidation or EMA line.
- Close the trade when price reaches the next lower Fibonacci zone or when the EMA line shifts to blue.
Case Study 1: NZDUSD M1 Buy Reaction
On NZDUSD M1 during the London session, price dipped and touched the green Fibonacci resistance level from below.
At the same time, the EMA line was blue, indicating bullish momentum.
A buy trade was taken at candle close with the stop placed just under the recent consolidation.
Price reacted sharply and began advancing upward.
The position was exited as price approached the next Fibonacci zone, giving a quick 10 pip scalp that aligned with both the trend direction and dynamic resistance structure.
Case Study 2: USDCAD M5 Sell Reaction
On USDCAD M5 during the New York session, price climbed and touched the red Fibonacci support level from above.
The EMA line was orange, confirming bearish conditions.
A sell trade was initiated at the touch candle’s close. The stop loss was placed above the recent high.
Price dropped in a series of bearish candles.
The trade concluded when price hit the next lower Fibonacci level, capturing the move efficiently while respecting the trend filter.
Download Now
FAQ
What do the different colors represent in this system?
The green and red lines are your primary entry triggers for buys and sells.
The lime and magenta lines are specifically placed as target levels where the momentum is expected to pause or reverse.
Can I change the timeframe for the calculations?
Yes, the indicator input allows you to choose the timeframe for the Fibonacci levels.
You can display H1 levels on an M5 chart to trade intraday moves with higher-timeframe significance.
Is this system better for trending or ranging markets?
The system excels in trending markets where price breaks out of a range toward the Fibonacci targets.
In very flat markets, price may bounce between levels without hitting the take profit zones.
Summary
The Fibonacci Forex Scalper system streamlines technical analysis by projecting mathematical levels that act as objective entry and exit points.
Using color-coded zones reduces the complexity often associated with Fibonacci trading.
This makes it an excellent choice for scalpers who require fast execution and clear profit objectives.
Overall, it is a robust utility that provides a consistent buy/sell framework for navigating intraday price volatility.


