
About the Figurelli Pivot Forex Indicator
The Figurelli Pivot Indicator for MT4 is a precise, lag-free tool that displays the daily Figurelli Pivot along with its associated support and resistance levels.
It provides traders with a clear representation of key price zones directly on the chart, making it easier to spot potential trade setups.
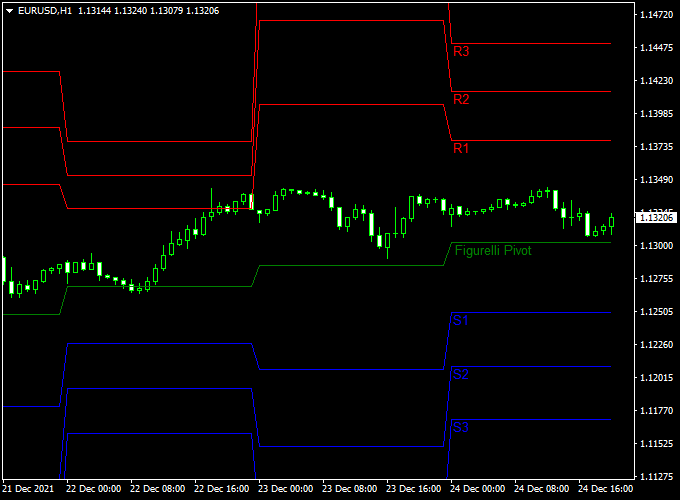
Appearing in the main MT4 chart window, the indicator plots the pivot point as well as S1, S2, S3 support levels and R1, R2, R3 resistance levels.
Because it is based on pure price action, it reacts instantly to market changes without lag, allowing traders to make timely and informed decisions.
Figurelli Pivot is used by both beginners and professional traders for planning entries, exits, and take profits, especially in trending or volatile markets.
Free Download
Download the “figurelli-pivot-indicator.mq4” indicator for MT4
Key Features
- Displays the Figurelli Pivot point along with S1–S3 support and R1–R3 resistance levels
- Lag-free, reacts instantly to price movements
- Works directly on the main MT4 chart window
- Based entirely on price action
- Helps identify potential reversal zones and trend continuation levels
Indicator Chart
The chart example shows the pivot point with its corresponding support and resistance levels plotted on the price action.
Traders can observe how price interacts with these zones—bouncing, breaking, or consolidating—to identify potential buy or sell opportunities and plan exits.
Guide to Trade with the Figurelli Pivot Indicator
Buy Rules
- Wait for the price to close above the pivot point.
- Confirm bullish momentum with a series of bullish candles or a price bounce from support.
- Enter a buy trade at the opening of the next candle.
Sell Rules
- Wait for the price to close below the pivot point.
- Confirm bearish momentum with rejection candles or a series of lower closes.
- Enter a sell trade at the start of the next candle.
Stop Loss Placement
- For buy trades, place the stop loss slightly below the nearest support level (S1–S3).
- For sell trades, place the stop loss slightly above the nearest resistance level (R1–R3).
Take Profit Targets
- For buy trades, set take profits at resistance levels (R1, R2, R3) sequentially.
- For sell trades, set take profits at support levels (S1, S2, S3) sequentially.
- Trailing stops can be used to lock in gains during trending moves.
Practical Trading Tips
- Observe price reaction at pivot and support/resistance zones to identify high-probability setups.
- Customize line colors for optimal chart readability.
MT4 Scalping Strategy: Figurelli Pivot & Entry Take Profit Forex Winner
This scalping strategy combines the Figurelli Pivot Indicator MT4 and the Entry Take Profit Forex Winner Indicator MT4 to capture short-term price movements with high precision.
The Figurelli Pivot Indicator identifies key daily pivot points and Fibonacci support and resistance levels.
The Entry Take Profit Forex Winner Indicator provides visual confirmation of trade direction with blue arrows for buy signals and red arrows for sell signals.
This strategy is ideal for scalping on lower timeframes like 1-minute, 5-minute, or 15-minute charts.
Buy Entry Rules
- Price closes above the Figurelli Pivot, signaling bullish momentum.
- Confirm with a blue arrow from the Entry Take Profit Forex Winner Indicator.
- Enter a buy position at the open of the next candle.
- Set stop loss just below the pivot point or recent swing low.
- Take profit at the nearest Fibonacci resistance level indicated by the Figurelli Pivot Indicator.
Sell Entry Rules
- Price closes below the Figurelli Pivot, signaling bearish momentum.
- Confirm with a red arrow from the Entry Take Profit Forex Winner Indicator.
- Enter a sell position at the open of the next candle.
- Set stop loss just above the pivot point or recent swing high.
- Take profit at the nearest Fibonacci support level indicated by the Figurelli Pivot Indicator.
Advantages
- Combines pivot points and Fibonacci levels for precise scalping entries and exits.
- Buy/sell arrow confirmation reduces false signals and improves timing.
- Works well on short-term charts, allowing multiple trades per day.
- Easy to follow, suitable for both beginner and experienced scalpers.
Drawbacks
- Requires fast execution and constant monitoring, which can be stressful for some traders.
- Risk management is essential, as scalping involves tight stop losses and frequent trades.
Case Study 1: EUR/GBP 5-Minute Chart
On the EUR/GBP 5-minute chart, the price closed above the Figurelli Pivot, and a blue arrow appeared on the Entry Take Profit Forex Winner Indicator.
A buy trade was entered at the open of the next candle, with a stop loss just below the pivot.
The price moved upward and reached the first Fibonacci resistance level, securing a profit of approximately 12 pips.
Case Study 2: AUD/USD 1-Minute Chart
On the AUD/USD 1-minute chart, the price closed below the Figurelli Pivot, and a red arrow appeared on the Entry Take Profit Forex Winner Indicator.
A sell trade was entered at the next candle with a stop loss above the pivot.
The price quickly fell to the first Fibonacci support level, resulting in a profit of around 8 pips, illustrating the effectiveness of this strategy for fast scalping trades.
Strategy Tips
- Focus on high liquidity pairs for tighter spreads and better scalping results.
- Use this strategy during peak market sessions for stronger price movements.
- Stick to the stop loss and take profit levels to maintain disciplined risk management.
Download Now
Download the “figurelli-pivot-indicator.mq4” indicator for Metatrader 4
FAQ
What makes Figurelli Pivot different from standard pivot indicators?
Unlike standard pivot tools, Figurelli Pivot calculates support and resistance levels based purely on price action, providing real-time, lag-free levels that adapt instantly to market movements.
Can this indicator help in both trending and sideways markets?
Yes. In trending markets, it identifies continuation zones, while in ranging markets, it highlights potential reversal points near the pivot, S, and R levels.
How should I use the support and resistance levels?
Support levels (S1–S3) can act as potential bounce points for buy trades, while resistance levels (R1–R3) can serve as profit targets or sell zones.
Observing price behavior near these levels increases trade accuracy.
Is the Figurelli Pivot suitable for short-term scalping?
Yes. Its real-time, lag-free calculation makes it useful for scalping, intraday, and swing trades alike. Traders can monitor quick price reactions at pivot levels for fast entries and exits.
Summary
The Figurelli Pivot Indicator for MT4 provides a precise, lag-free view of daily pivot points and associated support and resistance levels.
It helps traders identify potential buy or sell zones, plan take profits, and manage risk efficiently.
Its reliance on pure price action makes it responsive to market changes, giving traders confidence in timing entries and exits.


