
About the Future Price Prediction Indicator
The Future Price Prediction Indicator for MT4 is a technical oscillator designed to forecast short-term price movements.
It plots a blue signal line in a separate MT4 chart window that moves above and below key threshold levels.
The indicator helps traders anticipate price direction before it fully develops.
When the blue line rises above the 0.001 level, it signals bullish momentum.
When it falls below the 0.0005 level, it signals bearish momentum.
This tool works on all timeframes and currency pairs and is suitable for scalping, intraday trading, and swing trades.
Its simple oscillator design makes it easy to spot potential entry and exit points without cluttering the chart.
Free Download
Download the “Future Prediction.ex4” indicator for MT4
Key Features
- Blue oscillator line showing predicted price direction
- Overbought level at 0.001, oversold level at 0.0005
- Plotted in a separate MT4 chart window
- Ideal for anticipating short-term market moves
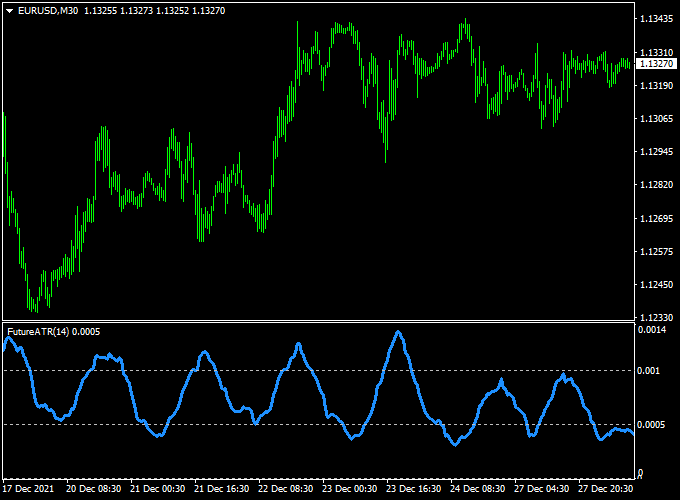
Indicator Chart
The chart shows the Future Price Prediction oscillator applied to MT4.
Blue line movement above 0.001 signals a buy, and below 0.0005 signals a sell.
Traders can follow these thresholds to enter trades in the direction of predicted price moves.
Guide to Trade with the Future Price Prediction Indicator
Buy Rules
- Open a buy trade when the blue line crosses above 0.001
- Confirm bullish momentum or trend
- Enter at the next candle open
Sell Rules
- Open a sell trade when the blue line crosses below 0.0005
- Confirm bearish momentum or trend
- Enter at the next candle open
Stop Loss
- For buy trades, place a stop 2–3 pips below the most recent swing low
- For sell trades, place a stop 2–3 pips above the most recent swing high
- Use a small buffer to avoid being stopped out by minor price spikes
Take Profit
- Target the next support for sell trades and resistance for buy trades
- Partial profit can be taken near intermediate levels
- Use a trailing stop to capture larger moves
- Exit if the oscillator reverses past the opposite threshold
Practical Tips
- Trade in the direction of the oscillator trend for higher probability
- Combine with higher timeframe confirmation
- Focus on clean threshold crossovers for entry
- Monitor multiple pairs for best setups
Future Price Prediction + 2 EMAs Colored Crossover MT4 Strategy
This MT4 strategy merges the Future Price Prediction Indicator with the 2 EMAs Colored Crossover System Indicator.
By combining predictive momentum from the first indicator with trend direction from the second, traders can identify higher-probability entries.
This strategy is suitable for 15-minute, 30-minute, and 1-hour charts and works well for both day traders and swing traders seeking clear signals.
The Future Price Prediction Indicator plots a blue line in a subchart.
A buy signal appears when the line crosses back above the 0.005 level, while a sell signal appears when the line crosses back below the 0.001 level.
The 2 EMAs Colored Crossover System Indicator confirms the trend.
Two green EMA lines indicate a bullish trend, while two red EMA lines show a bearish trend.
Using these indicators together allows traders to filter out false signals and trade with the prevailing market bias.
Buy Entry Rules
- Wait for the Future Price Prediction Indicator blue line to cross back above the 0.005 level in the subchart.
- Confirm that the 2 EMAs Colored Crossover System Indicator is showing two green EMA lines (bullish trend).
- Place a buy order on the next candle close after both conditions align.
- Set a stop loss just below the recent swing low or nearest support level.
- Take profit at the next resistance level or at least twice your risk.
Sell Entry Rules
- Wait for the Future Price Prediction Indicator blue line to cross back below the 0.001 level in the subchart.
- Confirm that the 2 EMAs Colored Crossover System Indicator is showing two red EMA lines (bearish trend).
- Place a sell order on the next candle close after both conditions align.
- Set a stop loss just above the recent swing high or nearest resistance level.
- Take profit at the next support level or at least twice your risk.
Advantages
- Combines predictive momentum with trend confirmation for stronger signals.
- Applicable to multiple timeframes and currency pairs.
- Flexible stop-loss and take-profit placement based on recent highs/lows.
Drawbacks
- False signals may appear in highly volatile or news-driven markets.
- Requires waiting for both conditions to align, which may limit the frequency of trades.
- Signals can lag slightly during swift price movements.
Case Study 1: AUD/USD 30-Minute Chart
On the AUD/USD 30-minute chart, the blue line of the Future Price Prediction Indicator crossed above 0.005.
The 2 EMAs Colored Crossover System showed two green EMA lines.
A buy trade was entered at 0.6470 with a stop loss at 0.6445.
The price rose steadily to 0.6530, capturing a 60-pip gain at the next resistance level.
This shows how combining predictive and trend-based signals can improve trade quality.
Case Study 2: USD/CHF 1-Hour Chart
On the USD/CHF 1-hour chart, the blue line of the Future Price Prediction Indicator crossed below 0.001.
The 2 EMAs Colored Crossover System displayed two red EMA lines.
A sell order was opened at 0.9005 with a stop loss at 0.9055.
The pair dropped to 0.8885 within several hours, resulting in a 120-pip profit near the next support zone.
This example demonstrates how the strategy can be effective in bearish trends as well.
Strategy Tips
- Test the strategy on a demo account to familiarize yourself with the signals.
- Use higher timeframes like H1 for stronger confirmation and fewer false moves.
- Combine this setup with support and resistance levels for more reliable targets.
- Avoid entering trades during major economic news releases to reduce whipsaw risks.
Download Now
Download the “Future Prediction.ex4” indicator for Metatrader 4
FAQ
How does the indicator predict price movements?
It uses a technical oscillator that measures momentum relative to threshold levels to anticipate short-term price direction.
Can it be used for scalping?
Yes, it works well on lower timeframes, but confirming the overall trend helps reduce false signals.
What are the threshold levels for?
The 0.001 level signals a potential bullish entry, and the 0.0005 level signals a potential bearish entry. They act as triggers for trades.
Summary
The Future Price Prediction Indicator for MT4 forecasts short-term price movements using a blue oscillator line.
It allows traders to anticipate buy and sell opportunities before the market fully moves.
Flexible across timeframes and currency pairs, the indicator works best when combined with trend or momentum tools for confirmation and higher probability trades.


