
About the FXSSI Support and Resistance Indicator
The FXSSI Support and Resistance Indicator for MT5 identifies significant support and resistance zones and displays them as rectangular areas on your price chart.
It tracks how often price interacts with each level, giving traders insight into market behavior.
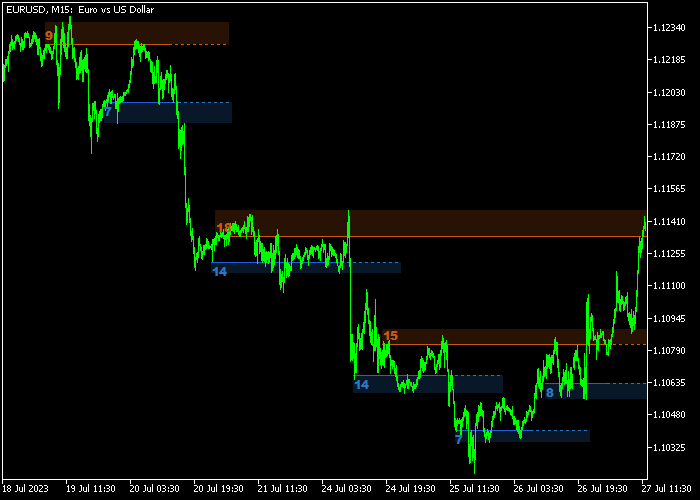
For example, a number “8” above a zone shows that price has tested that level eight times.
Understanding these levels helps traders anticipate potential reversals or trend continuations.
A candle closing above resistance may indicate bullish momentum, while a candle closing below support may suggest bearish pressure.
It is highly customizable, including vertical width, frequency of levels, display options, and colors.
Free Download
FXSSI SupportResistance.mq5 Indicator (MT5)
Key Features
- Displays key support and resistance areas as rectangles.
- Shows the number of times price interacts with each zone.
- Supports all timeframes and trading instruments.
- Customizable level width, display frequency, and colors.
- Assists in identifying trend continuations and reversals.
- Provides a visual reference for strategic trade entries and exits.
Indicator Chart
The indicator shows blue and brown rectangular support and resistance zones directly on the price chart.
It highlights areas where price has tested levels multiple times, allowing traders to anticipate potential reversals or breakouts.
The interaction count above each zone provides insight into the strength of the level.
Guide to Trade with FXSSI Support and Resistance Indicator
Buy Rules
- Confirm that the primary trend is upward.
- Enter a buy order when the candle closes above a rectangular resistance zone.
- Monitor subsequent resistance levels for price interaction.
- Consider skipping the trade if price repeatedly fails to break higher levels.
Sell Rules
- Confirm that the primary trend is downward.
- Enter a sell order when the candle closes below a rectangular support zone.
- Monitor subsequent support levels for price interaction.
- Consider skipping the trade if price repeatedly fails to break lower levels.
Stop Loss
- Set a protective stop a few pips below the nearest swing low for buy trades.
- Set a protective stop a few pips above the nearest swing high for sell trades.
- Use trailing stops to limit losses while allowing levels to play out.
Take Profits
- Target the next key support or resistance level for exits.
- Scale out positions if momentum slows near tested zones.
- Close trades if price repeatedly fails to break the next level.
FXSSI Support and Resistance + AMA Wave Scalping Strategy MT5
This scalping strategy combines the FXSSI Support and Resistance indicator for MT5 with the AMA Wave Forex indicator for MT5.
It focuses on trading strong reactions at key price zones while using momentum confirmation from the AMA Wave histogram.
The idea is simple. Price reacts to clearly defined support and resistance zones, and momentum confirms whether a breakout or rejection is likely to continue.
This makes the strategy effective for short-term trading where timing matters.
This strategy works best on lower timeframes such as M5 and M15.
Buy Entry Rules
- Wait for the candle to close clearly above a rectangular resistance zone from the FXSSI Support and Resistance indicator.
- Confirm that the AMA Wave histogram turns sea-green and shows upward momentum.
- Enter a buy trade at the close of the breakout candle.
- Place the stop loss just below the broken resistance zone.
- Take profit when the AMA Wave histogram weakens or changes color, or at the next resistance level.
Sell Entry Rules
- Wait for the candle to close clearly below a rectangular support zone from the FXSSI Support and Resistance indicator.
- Confirm that the AMA Wave histogram turns pink and shows downward momentum.
- Enter a sell trade at the close of the breakout candle.
- Place the stop loss just above the broken support zone.
- Take profit when the AMA Wave histogram weakens or changes color, or at the next support level.
Case Study 1: EUR/USD M5 Buy Breakout
On the EUR/USD M5 timeframe, price was moving sideways and approached a well-defined resistance zone.
A strong bullish candle closed above the rectangular resistance area, confirming a breakout.
At the same time, the AMA Wave histogram turned sea-green, showing increasing bullish momentum.
A buy trade was opened immediately after the candle close.
The stop loss was placed just below the resistance zone, which then acted as support.
Price continued to rise with steady momentum, and the buy trade was closed when the AMA Wave histogram started to fade, locking in a quick scalping gain.
Case Study 2: GBP/JPY M15 Sell Breakdown
On the GBP/JPY M15 timeframe, price was consolidating near a support zone and eventually broke below it with a strong bearish candle close.
This confirmed a sell opportunity as the level failed to hold.
The AMA Wave histogram turned pink at the same moment, confirming bearish momentum.
A sell trade was executed at candle close, with a stop loss placed just above the broken support level.
Price continued downward, and the sell trade was closed as momentum slowed, capturing a clean scalping move.
Download Now
FXSSI SupportResistance.mq5 Indicator (MT5)
FAQ
Can I adjust the width and color of support and resistance levels?
Yes. You can customize the vertical width, colors, and display frequency of each zone to match your chart style.
Does it track the number of interactions with each level?
Yes. A number above each zone indicates how many times price has tested that level.
Is this suitable for both scalpers and swing traders?
Yes. Scalpers can use it for short-term reversals, while swing traders can monitor major zones for broader trend analysis.
Summary
The FXSSI Support and Resistance indicator highlights key market levels and tracks price interactions for smarter trading decisions.
By identifying zones where price repeatedly reacts, traders can anticipate reversals, breakouts, or trend continuations.
This tool is highly customizable and works across all timeframes and instruments.
Using it in combination with trend analysis or other strategies helps improve trade timing, manage risk, and maximize potential profit.


