
About the Heatmap Gradient Scale Indicator
The Heatmap Gradient Scale indicator for Metatrader 5 is a dashboard-style tool that provides a visual overview of percentage gains and losses across various currency pairs.
It functions as a strength meter, allowing traders to see which currencies are outperforming or underperforming at any given moment.
The primary benefit of this indicator is its ability to highlight market sentiment through a color-coded interface.
It allows for quick decision-making by showing the intensity of bullish or bearish pressure in real-time.
Whether you are looking for high-volatility pairs or stable trends, the Heatmap Gradient Scale provides the necessary data to align your trades with the strongest market moves.
Free Download
Heatmap_Gradient_Scale.mq5 Indicator (MT5)
Key Features
- The indicator displays a compact dashboard in the corner of the chart for easy monitoring.
- Color gradients from green to red represent the spectrum of bullish and bearish strength.
- Percentage-based calculations provide an objective measure of currency performance.
- The interface updates in real-time to reflect current price action and momentum shifts.
- The indicator type and display settings are fully customizable to suit individual trading needs.
Indicator Chart
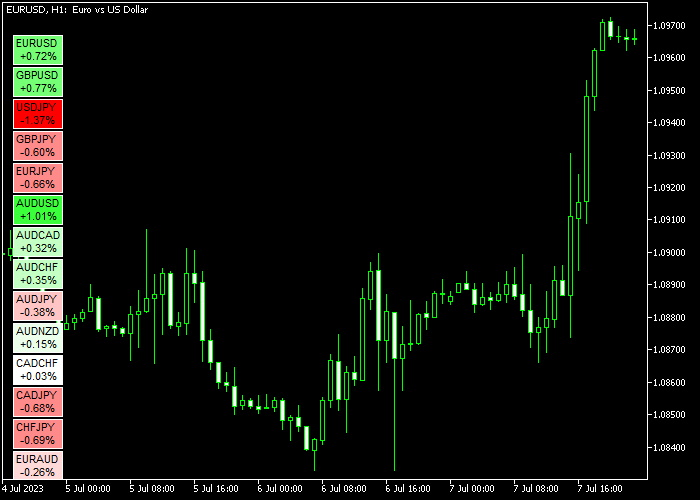
The chart shows the Heatmap Gradient Scale indicator as a mini dashboard on an MT5 workspace.
You can see how various currency pairs are ranked by their percentage change, with bright green representing strong buyers and bright red representing strong sellers.
Guide to Trade with Heatmap Gradient Scale indicator
Buy Rules
- Select a currency pair that displays a green colored heatmap, indicating a strong bullish trend.
- Look for the MACD histogram to cross above the signal line or move above the zero level.
- Execute a buy market order once the strong Heatmap strength is confirmed by the MACD momentum.
- Ensure the Heatmap remains green to validate that the bullish pressure is still active.
Sell Rules
- Choose a currency pair that shows a red colored heatmap, signaling a strong bearish trend.
- Wait for the MACD histogram to cross below the signal line or drop into negative territory.
- Enter a sell market order when both the Heatmap and MACD signal a high-probability bearish move.
- Maintain the short position as long as the Heatmap remains red and momentum stays downward.
Stop Loss
- Place a protective stop loss below the most recent swing support for all buy positions.
- Set your stop loss above the nearest local resistance level for any sell trade.
- Utilize the MACD reversal as a secondary indicator for adjusting your protective stops.
- Move the stop to break-even once the pair gains significant distance from your entry point.
Take Profit
- Exit the trade when the Heatmap color changes from strong green/red to light-green/light-red.
- Alternatively, close the position when the MACD shows a counter-trend crossover.
- Targeting a fixed profit based on recent daily volatility is a sound exit strategy.
- Manual exits are recommended if the percentage gain on the Heatmap begins to shrink rapidly.
Heatmap Gradient Scale Indicator Day Trading Strategy with JMA
This strategy focuses on selecting strong currency pairs and timing entries with precision.
The Heatmap Gradient Scale Forex Indicator helps traders quickly identify the strongest and weakest pairs in the market.
A green heatmap highlights strong bullish conditions, while a red heatmap signals clear bearish pressure.
The Jurik Moving Average Indicator refines entries by providing a smooth and highly responsive trend line.
It reduces lag and filters out noise, allowing traders to react faster to price changes while staying aligned with the main trend.
This approach works best on M15 and M30 charts and suits traders who want to focus on the strongest opportunities during active sessions.
Buy Entry Rules
- Select a currency pair that shows a green heatmap, confirming strong bullish conditions.
- Wait for price to approach the Jurik Moving Average from below.
- Enter a buy trade when a candle closes above the moving average.
- Place the stop loss below the Jurik Moving Average or the recent swing low.
- Close the trade when price drops back below the moving average or when momentum weakens.
Sell Entry Rules
- Select a currency pair that displays a red heatmap, indicating strong bearish conditions.
- Wait for price to retrace toward the Jurik Moving Average from above.
- Enter a sell trade when a candle closes below the moving average.
- Place the stop loss above the Jurik Moving Average or the recent swing high.
- Close the trade when price moves back above the moving average or when bearish pressure fades.
Case Study 1: EUR/USD Buy Trade M30
During the London session, EUR/USD appeared with a strong green heatmap reading, indicating bullish strength compared to other pairs.
Price pulled back toward the Jurik Moving Average but maintained an overall upward structure.
A bullish candle closed above the moving average, confirming continuation.
A buy trade was opened with the stop loss placed below the recent low.
Price resumed its upward movement with steady momentum.
The position was closed for a small loss after price started to lose strength and dipped back toward the moving average.
Case Study 2: GBP/CHF Sell Trade M15
In the New York session, GBP/CHF showed a clear red heatmap, highlighting strong bearish sentiment.
Price retraced upward slightly but remained below key levels.
When a candle closed below the Jurik Moving Average after the pullback, a sell trade was initiated.
The stop loss was placed above the recent swing high. Price continued to fall as bearish momentum increased.
The trade was exited when price began to stall and move back toward the moving average, locking in 30 pips from the downward move.
Download Now
Heatmap_Gradient_Scale.mq5 Indicator (MT5)
FAQ
What do the different colors mean?
Green indicates a strong bullish trend, while light-green suggests weak buying.
Red represents a strong bearish trend, and light-red indicates weak selling pressure.
Can I trade directly from the heatmap?
The heatmap is a sentiment filter.
It is best used to pick the pair, while a secondary indicator like the MACD is used to find the exact entry and exit timing.
How often does the dashboard update?
The Heatmap Gradient Scale updates in real-time with every price tick, ensuring the percentage changes and colors reflect the most current market state.
Summary
The Heatmap Gradient Scale indicator is a popular trend analysis tool offering reliable signals for buying and selling pairs in the Forex market.
It provides a visual shortcut for identifying currency strength and weakness across the entire market.
When used alongside the MACD, it creates a robust system for following momentum with precision.
Overall, it is an efficient tool for traders who want to stay focused on the most profitable trending opportunities.


