
About the Hurst Bands Indicator
The Hurst Bands Indicator for MT5 is a trend-following tool designed to help traders identify market direction and refine trade entries and exits.
It plots a single red line on the main price chart that adjusts according to the prevailing trend.
The line moves with price action and provides a visual reference for whether the market is trending up or down.
Traders can use it as a standalone indicator or combine it with other technical tools for trend confirmation.
An upward-sloping red Hurst Bands line suggests bullish momentum, while a downward-sloping line indicates bearish conditions.
Traders can customize several inputs including the period, inner and outer values, extreme value, and options to display inner, outer, and extreme lines.
Free Download
Hurst_Bands.mq5 Indicator (MT5)
Key Features
- Plots a dynamic red line to indicate market trends.
- Helps identify potential buy and sell points.
- Upward slope signals bullish momentum; downward slope signals bearish momentum.
- Customizable period and band values.
- Options to display inner, outer, and extreme lines.
Indicator Chart
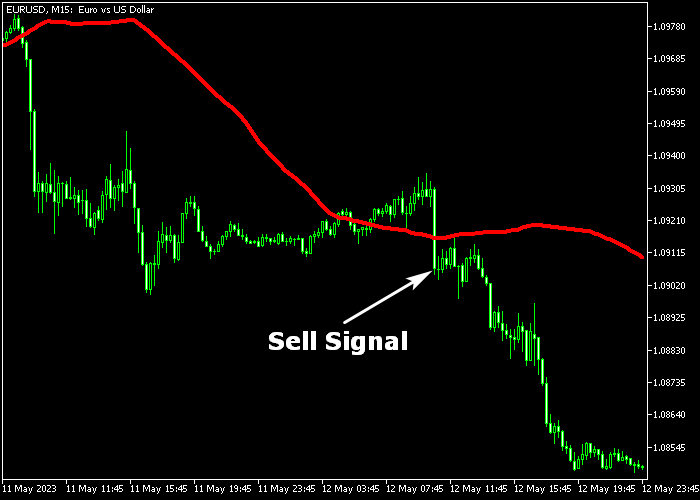
The Hurst Bands Indicator appears directly on the main chart window as a red line that moves with price action.
In the example, the line slopes upward during bullish trends and downward during bearish trends, helping traders determine potential entry and exit points.
Guide to Trade with Hurst Bands Indicator
Buy Rules
- Observe when the candle crosses the red line from below.
- This crossover suggests bullish momentum may be forming.
- Open a buy trade after the candle closes above the line.
- Monitor trend continuation and price action for confirmation.
Sell Rules
- Watch for candles crossing the red line from above.
- This movement signals potential bearish momentum.
- Open a sell trade after the candle closes below the line.
- Confirm trend strength with additional indicators if needed.
Stop Loss
- For buy trades, place the stop a few pips below the last consolidation area.
- For sell trades, place the stop a few pips above the last consolidation area.
- Always ensure the stop aligns with your risk management rules.
Take Profit
- Close buy trades if the candle crosses back below the red line.
- Close sell trades if the candle crosses back above the red line.
- Traders can trail stops along the Hurst Bands line for extended trends.
Hurst Bands + TRIX Candle Forex Strategy for MT5
This strategy combines the Hurst Bands Indicator with the TRIX Candle Indicator to create a clear trend-following system for scalping and day trading.
The Hurst Bands indicator acts as a dynamic trend filter.
When price stays above the red Hurst line, the market is considered bullish. When price moves below the red line, the market is bearish.
The TRIX Candle indicator provides momentum-based entry signals in a separate window.
A sea-green candle indicates bullish momentum, while a magenta candle signals bearish momentum.
This combination works best on M1 and M5 timeframes for fast entries with trend confirmation.
Buy Entry Rules
- Confirm that price is above the red Hurst Bands line, indicating a bullish market.
- Wait for a sea-green TRIX candle to appear in the indicator window.
- Enter a buy trade at the close of the signal candle.
- Place the stop loss below the most recent swing low or below the Hurst red line.
- Close the trade when a magenta TRIX candle appears or when the candle closes below the Hurst red line.
Sell Entry Rules
- Confirm that price is below the red Hurst Bands line, indicating a bearish market.
- Wait for a magenta TRIX candle to appear in the indicator window.
- Enter a sell trade at the close of the signal candle.
- Place stop loss above the most recent swing high or above the Hurst red line.
- Close the trade when a sea-green TRIX candle appears or when the candle closes above the Hurst red line.
Case Study 1: EURUSD M5 London Session Buy Trade
On EURUSD M5 during the London session, price moved above the Hurst red line and stayed there, confirming a bullish trend.
Shortly after, a sea-green TRIX candle appeared, signaling strong upward momentum.
A buy trade was opened at the close of that candle.
The stop loss was placed below the recent swing low, just under the Hurst line for added protection.
The trade was closed when a magenta TRIX candle appeared while price started losing strength near resistance.
This clearly signaled that bullish momentum had ended.
Case Study 2: GBPUSD M1 New York Session Sell Trade
On GBPUSD M1 during the New York session, price stayed below the Hurst red line, confirming a bearish trend.
A magenta TRIX candle appeared, indicating strong selling pressure.
A sell trade was opened at the close of the signal candle.
The stop loss was placed above the recent swing high, slightly above the Hurst line.
The trade was closed when a sea-green TRIX candle formed and price pushed back above the Hurst line.
This showed that sellers were losing control and a reversal was likely.
Download Now
Hurst_Bands.mq5 Indicator (MT5)
FAQ
How does the Hurst Bands indicator work?
The indicator plots a red line on the chart that follows the trend.
Candle crossovers of the line act as potential buy or sell signals depending on the direction of the move.
Can it be used with other indicators?
Yes. Many traders use it alongside oscillators, moving averages, or support/resistance levels to confirm trend direction and entry points.
Which timeframes are most effective?
The Hurst Bands Indicator works on all timeframes, but using it during high-volume sessions like London and New York can improve signal reliability on lower timeframes.
Summary
The Hurst Bands Indicator offers traders a simple visual method for tracking trends and identifying potential entry and exit points.
Its dynamic red line clearly shows bullish and bearish market momentum.
With adjustable parameters and compatibility with other technical tools, the indicator can support both trend-following and breakout strategies.
It provides clear guidance for trade timing while remaining flexible across timeframes and instruments.


