About the Inside Bar Scanner Indicator
The Inside Bar Scanner indicator for MT5 is a technical tool that identifies the inside bar candlestick pattern across currency pairs.
This pattern occurs when a smaller candle is completely engulfed by the range of the preceding larger candle, representing a period of market consolidation or indecision.
By highlighting these zones in a dedicated window, the indicator helps traders anticipate potential breakouts.
It acts as a volatility filter, signaling that the market is building energy for a significant move once the consolidation phase ends.
Free Download
geo_innerbar.mq5 Indicator (MT5)
Key Features
- The indicator automatically scans and identifies inside bar patterns in real-time.
- Patterns are visually represented as orange bars in a separate indicator window.
- It simplifies the detection of market consolidation phases without manual chart scanning.
- Customizable color settings allow for seamless integration with any trading template.
- The tool is compatible with all timeframes and financial instruments available on MT5.
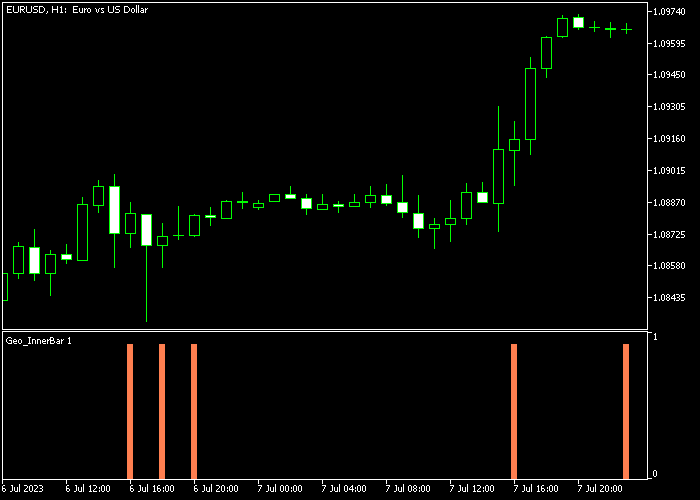
Indicator Chart
The chart displays the Inside Bar Scanner indicator with orange vertical bars in the sub-window.
These bars mark the exact moments when price action becomes contained within a previous candle’s range.
Traders use these markers to prepare for a breakout above or below the mother bar’s high or low.

Guide to Trade with the Inside Bar Scanner indicator
Buy Rules
- Monitor the indicator for the appearance of an orange inside bar signal.
- Ensure the breakout aligns with a bullish market structure or support level.
- Enter the trade once the price successfully breaches the high of the pattern.
Sell Rules
- Identify a new inside bar pattern via the orange signal in the indicator window.
- Confirm that the bearish breakout is supported by the overall downward trend.
- Execute the sell trade when price action moves below the pattern’s bottom range.
Stop Loss
- For buy trades, place a protective stop loss below the low of the inside bar or mother bar.
- For sell trades, set the stop loss above the high of the inside bar or mother bar.
- Using the halfway point of the mother bar can also serve as a tighter stop for aggressive traders.
Take Profit
- Target a fixed profit objective based on the height of the mother bar (1:1 or 2:1 ratio).
- Exit the trade at the nearest major support or resistance level.
- Close the position if a new inside bar forms in the opposite direction.
- Trailing stops are recommended to capture extended moves following a breakout.
Inside Bar Scanner Breakout MT5 Strategy with VWAP Bands
This breakout strategy uses price consolidation and trend confirmation to capture strong intraday moves.
The Inside Bar Scanner Indicator identifies inside bars, which signal periods of low volatility that often precede breakouts.
An orange inside bar marks potential entry points for both buying and selling, depending on the direction of the breakout.
The VWAP Bands Indicator helps determine the overall trend.
When the bands slope upward, the market is bullish, supporting buy breakouts.
When they slope downward, the market is bearish, favoring sell breakouts.
This strategy works well on M15 and M30 timeframes and is ideal for traders focusing on strong intraday moves in major currency pairs.
Buy Entry Rules
- Confirm that the VWAP bands are sloping upward, indicating a bullish trend.
- Identify an orange inside bar as a potential breakout setup.
- Enter a buy trade when price breaks above the high of the inside bar.
- Place the stop loss below the low of the inside bar.
- Close the trade when price shows signs of stalling or breaks back below the inside bar low.
Sell Entry Rules
- Confirm that the VWAP bands are sloping downward, indicating a bearish trend.
- Identify an orange inside bar as a potential breakout setup.
- Enter a sell trade when price breaks below the low of the inside bar.
- Place the stop loss above the high of the inside bar.
- Close the trade when price shows signs of reversal or breaks back above the inside bar high.
Case Study 1: EUR/USD Buy Breakout (M15)
During the London session, EUR/USD formed an orange inside bar while the VWAP bands were sloping upward.
Price broke above the high of the inside bar, signaling a buy opportunity.
A buy trade was entered at the breakout. The stop loss was placed below the inside bar low.
Price accelerated upward following the breakout.
The trade was closed when momentum slowed down and a small pullback began, securing a successful intraday move.
Case Study 2: GBP/JPY Sell Breakout (M30)
During the New York session, GBP/JPY formed an orange inside bar while the VWAP bands were sloping downward.
Price broke below the low of the inside bar, confirming a sell breakout.
A sell trade was taken at the breakout point. The stop loss was placed above the inside bar high.
Price moved quickly in line with the trend.
The entire position was closed when price started retracing back toward the inside bar, locking in a 52 pip intraday profit.
Download Now
geo_innerbar.mq5 Indicator (MT5)
FAQ
What does the orange bar represent?
The orange bar indicates that the current candle’s high and low are within the range of the previous candle, signaling market indecision.
Can I use this for scalping?
Yes, inside bars are effective on M5 and M15 timeframes for capturing quick breakout moves during high-volatility sessions.
Is this a standalone strategy?
No, it is a pattern recognition tool. It should be combined with trend filters or volume analysis to avoid false breakouts in ranging markets.
Summary
The Inside Bar Scanner indicator is a popular trend analysis tool offering reliable signals for identifying price consolidation.
It automates the detection of a key price action pattern, helping traders prepare for high-momentum breakouts.
By focusing on periods of low volatility, it provides a disciplined way to enter the market just as a new move begins.
Overall, it is a practical tool for traders who prioritize price action and market structure.


