
About the Laguerre RSI Oscillator
The Laguerre RSI Oscillator for MT5 is a technical tool designed to spot oversold and overbought market conditions.
It helps traders find precise buy and sell opportunities in both sideways and trending markets.
By default, the oscillator considers the market overbought at 0.85 and oversold at 0.15.
Traders can use it alone for range-bound trading or combine it with a trend indicator for stronger signals in trending conditions.
Settings such as Laguerre RSI period, price, smoothing period, and level thresholds can be adjusted.
This allows traders to optimize the indicator for different currency pairs, timeframes, and market environments.
Free Download
Laguerre RSI – ng.mq5 Indicator (MT5)
Key Features
- Identifies overbought and oversold conditions in Forex markets.
- Red coloring signals oversold (buy) conditions; blue signals overbought (sell) conditions.
- Can be used as a standalone tool or with a trend indicator.
- Customizable Laguerre RSI period, smoothing period, and price type.
- Adjustable overbought and oversold levels for sensitivity tuning.
- Helps traders time entries and exits efficiently in various market conditions.
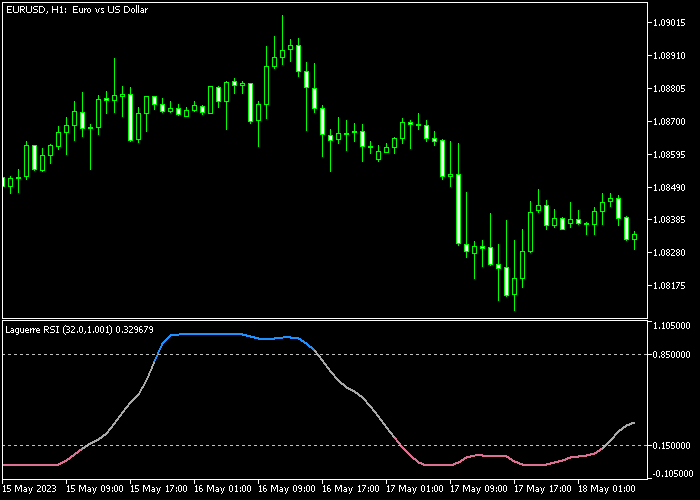
Indicator Chart
The Laguerre RSI Oscillator appears in a panel below the main price chart.
Red bars indicate oversold conditions, while blue bars indicate overbought conditions.
Traders monitor color changes in conjunction with market direction to find potential buy or sell entries and anticipate reversals.
Guide to Trade with Laguerre RSI Oscillator
Buy Rules
- Wait for the oscillator to turn red, indicating oversold conditions.
- Confirm that the market trend is upward.
- Enter a buy trade when both conditions align.
- Monitor the trend and oscillator to maintain the trade until exit conditions are met.
Sell Rules
- Wait for the oscillator to turn blue, indicating overbought conditions.
- Confirm that the market trend is downward.
- Enter a sell trade when both conditions align.
- Monitor the trend and oscillator to maintain the trade until exit conditions are met.
Stop Loss
- For buy trades, place the stop 3 pips below the nearest technical support.
- For sell trades, place the stop 3 pips above the nearest technical resistance.
Take Profit
- Close trades at a fixed take profit of your choice.
- Alternatively, exit when the oscillator changes color, signaling a potential reversal.
- Adjust the exit strategy based on market conditions and momentum.
Laguerre RSI Oscillator Trend Filter Forex Strategy for MT5
This strategy combines the Laguerre RSI Oscillator with the Instantaneous Trend Filter Indicator to build a precise trend-following system for the London and US sessions.
The Laguerre RSI Oscillator measures momentum using a smoothed RSI structure.
A transition to blue signals overbought conditions and potential bullish continuation, while a transition to red signals oversold conditions and potential bearish continuation.
This helps identify momentum exhaustion and early reversal zones.
The Instantaneous Trend Filter defines the main market direction.
A blue line indicates a bullish trend, while a magenta line indicates a bearish trend.
This filter helps traders stay aligned with the dominant intraday structure and avoid counter-trend entries.
This strategy works best on M5 and M15 charts during the London and US sessions when volatility and directional movement are strongest.
Buy Entry Rules
- Wait for the Instantaneous Trend Filter to turn blue, confirming a bullish trend.
- Wait for the Laguerre RSI Oscillator to turn red first (oversold condition), then reverse back upward.
- Enter a buy trade when the oscillator leaves the oversold zone and starts turning upward while trend is blue.
- Place stop loss below the most recent swing low or below the nearest support structure.
- Close the trade when the Laguerre RSI turns blue or when the trend filter switches to magenta.
Sell Entry Rules
- Wait for the Instantaneous Trend Filter to turn magenta, confirming a bearish trend.
- Wait for the Laguerre RSI Oscillator to turn blue first (overbought condition), then reverse downward.
- Enter a sell trade when the oscillator leaves the overbought zone and starts turning down while trend is magenta.
- Place stop loss above the most recent swing high or above the nearest resistance structure.
- Close the trade when the Laguerre RSI turns red or when the trend filter switches to blue.
Case Study 1: London Session Buy Setup (EURUSD M5)
During the London session, EURUSD moved into a clear bullish phase as the Instantaneous Trend Filter turned blue and price started holding above it.
Shortly after, the Laguerre RSI Oscillator dipped into the red oversold zone, showing temporary exhaustion inside the bullish trend.
Instead of continuing downward, the oscillator began turning back upward while the trend filter remained blue.
A buy trade was entered after confirmation of the upward turn.
The stop loss was placed just below the most recent swing low and under the last pullback wick to avoid being stopped by normal volatility.
Price then continued upward in short impulsive waves, respecting small retracements while staying aligned with the blue trend filter.
3 hours later, the long trade was closed when the Laguerre RSI shifted to blue, showing overbought conditions and slowing momentum.
Case Study 2: US Session Sell Setup (GBPJPY M15)
During the US session, GBPJPY failed to break higher and started forming lower highs.
The Instantaneous Trend Filter turned magenta, confirming bearish market conditions.
Later, the Laguerre RSI Oscillator pushed into the blue overbought zone during a retracement, showing exhaustion against the bearish trend.
The oscillator then began turning downward while the magenta trend remained active.
A sell trade was entered at the confirmation of downward reversal.
The stop loss was placed above the recent swing high and slightly above the resistance zone created during the pullback.
Price moved downward in a structured way with minor retracements but stayed below the trend filter.
The trade was closed when the Laguerre RSI turned red again, signaling oversold conditions and possible trend fatigue.
Download Now
Laguerre RSI – ng.mq5 Indicator (MT5)
FAQ
How does the Laguerre RSI Oscillator differ from standard RSI?
It uses a Laguerre smoothing method, making it more responsive and less noisy than the standard RSI, which helps identify precise oversold and overbought levels.
Can it be used in trending markets?
Yes. While effective in sideways markets, it can be combined with a trend indicator to filter signals and align trades with the market trend.
Are the oscillator signals reliable?
Yes. The non-repainting oscillator gives fixed red or blue signals that traders can trust for entry and exit decisions.
Summary
The Laguerre RSI Oscillator identifies overbought and oversold market conditions using red and blue signals.
Red highlights potential buy opportunities, while blue indicates potential sell opportunities.
Traders can use the oscillator alone in range-bound markets or with trend indicators in trending markets for stronger signals.
Non-repainting signals and adjustable levels make it flexible for different currency pairs, timeframes, and strategies.
With clear colored trading signals and customization options, the indicator helps traders anticipate reversals, time entries and exits effectively, and navigate both sideways and trending market conditions efficiently.


