
About the MACD Indicator
The MACD Indicator for MT5 (Moving Average Convergence Divergence) is a classic technical tool that helps traders spot market momentum and trend direction.
It is widely used to identify potential buy and sell signals in Forex and other financial markets.
The indicator works by comparing fast and slow exponential moving averages (EMAs) and plotting a histogram.
Bars above 0 suggest bullish momentum, while bars below 0 indicate bearish momentum.
Using MACD alongside a trend indicator, like the 100 SMA, improves signal reliability and reduces false entries.
Traders can customize the fast EMA period, slow EMA period, signal SMA period, applied price, and colors.
Practicing on a demo account before live trading is recommended to understand its behavior in different market conditions.
Free Download
Key Features
- Displays MACD histogram bars above and below zero to indicate buy or sell momentum.
- Customizable EMA periods, signal line, applied price, and colors.
- Signals trend reversals when the histogram crosses the zero level.
- Works on all MT5-supported instruments and timeframes.
- Combining with a trend indicator like 100 SMA improves accuracy.
- Suitable for scalping, intraday, and swing trading strategies.
- Easy to use for both beginners and experienced traders.
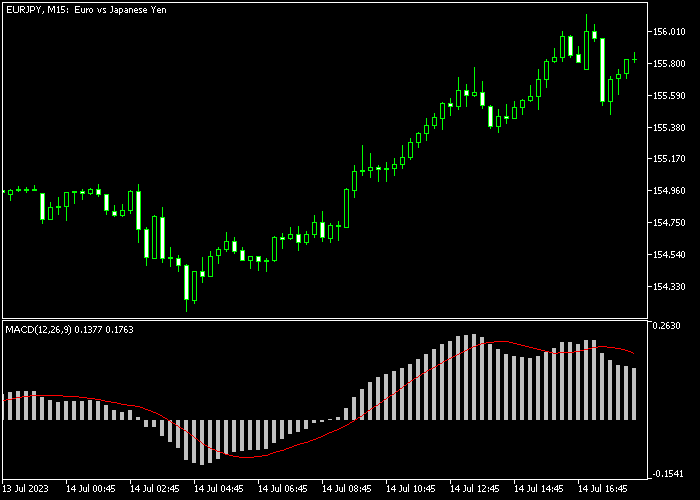
Indicator Chart
The MACD Indicator displays histogram bars in a separate chart window.
Bars above 0 indicate bullish momentum and potential buy trades, while bars below 0 indicate bearish momentum and potential sell trades.
Traders can observe the histogram in combination with a trend indicator, such as the 100 SMA, to confirm the overall market direction and improve entry timing.
Guide to Trade with the MACD Indicator
Buy Rules
- Open a buy trade when the MACD histogram bars cross back above 0 from below.
- Confirm that the overall trend is upward, preferably with the 100 SMA slope upward.
- Observe momentum strength before entering the trade.
- Monitor for reversal signals or zero-level crosses for timely exits.
Sell Rules
- Open a sell trade when the MACD histogram bars cross back below 0 from above.
- Confirm that the overall trend is downward, preferably with the 100 SMA slope downward.
- Observe momentum strength before entering the trade.
- Monitor for reversal signals or zero-level crosses for timely exits.
Stop Loss
- For buy trades, place the stop loss slightly below recent swing lows or support zones.
- For sell trades, place the stop loss slightly above recent swing highs or resistance zones.
- Optionally, use trailing stops along trend direction for added protection.
Take Profits
- For buy trades, close all buy trades when the MACD histogram crosses back below 0.
- For sell trades, close all sell trades when the MACD histogram crosses back above 0.
- Optionally, scale out partial positions at key support or resistance levels identified by price action for added profit security.
MACD Indicator and Elliott Wave Oscillator Day Trading Strategy for MT5
This day trading strategy combines momentum signals with trend confirmation to capture high-probability intraday moves.
It uses the MACD Indicator for MT5 for entry signals and the Elliott Wave Oscillator Indicator for MT5 to confirm trend direction.
Together, these tools help traders align trades with the prevailing momentum.
The MACD indicator provides clear entry signals. This allows traders to enter in the direction of short-term price swings.
The Elliott Wave Oscillator measures the trend strength.
A histogram above zero confirms a bullish trend, while a histogram below zero confirms a bearish trend.
Using both indicators together ensures entries align with the dominant market trend, reducing the risk of false trades.
This strategy works best on M15 and H1 charts during the London and New York sessions.
Buy Entry Rules
- Confirm that the Elliott Wave Oscillator histogram is above zero, indicating a bullish trend.
- Wait for the MACD line to move above zero to signal a buy entry.
- Enter a buy trade at the open of the next candle after both conditions are met.
- Place the stop loss below the recent swing low or a nearby support level.
- Take profit near the next resistance zone or exit if the MACD moves below zero or the Elliott Wave histogram turns negative.
Sell Entry Rules
- Confirm that the Elliott Wave Oscillator histogram is below zero, indicating a bearish trend.
- Wait for the MACD line to move below zero to signal a sell entry.
- Enter a sell trade at the next candle open after confirmation.
- Set the stop loss above the recent swing high or a nearby resistance area.
- Take profit near the next support or exit early if the MACD moves above zero or the Elliott Wave histogram turns positive.
Case Study 1: GBP/USD M15 Day Trade
During the London session, GBP/USD showed a bullish trend as the Elliott Wave Oscillator histogram remained above zero.
The MACD line crossed above zero after a minor retracement, signaling a buy opportunity.
A trade was opened at the next candle with the stop loss below the recent swing low.
Price moved upward steadily, and the position captured 25 pips before the MACD line signaled a slowing momentum.
Case Study 2: AUD/JPY H1 Day Trade
On the H1 chart, AUD/JPY displayed a bearish trend with the Elliott Wave Oscillator histogram below zero.
The MACD line fell below zero after a brief upward pullback, confirming a sell entry.
A short trade was taken with the stop loss above the recent swing high.
Price continued downward, and the short position closed when the histogram closed back above the zero level.
Download Now
FAQ
Can MACD be used alone?
Yes, it can provide signals by itself, but combining with a trend indicator like the 100 SMA improves accuracy and reduces false trades.
What do the histogram bars represent?
The histogram shows the difference between the MACD line and the signal line.
Bars above 0 indicate bullish momentum, bars below 0 indicate bearish momentum.
Can I customize MACD settings?
Yes. You can adjust fast EMA, slow EMA, signal SMA, applied price, and colors to fit your trading strategy.
Summary
The MACD Indicator is a reliable tool for identifying bullish and bearish momentum through histogram crossovers.
Using it with a trend indicator like the 100 SMA improves trade accuracy.
Buy signals occur when histogram bars cross above 0 in an uptrend, and sell signals when bars cross below 0 in a downtrend.
The indicator suits scalping, intraday, and swing trading.
Traders can set fixed pip targets or close trades when the histogram reverses, making it a flexible and practical trading tool.


