About the MACD Signal Oscillator Indicator
The MACD Signal Oscillator Indicator for MetaTrader 4 is a streamlined version of the classic MACD.
Instead of multiple lines or histograms, it provides a single signal line that makes trading decisions faster and simpler.
The indicator appears in its own chart window as a green line that oscillates around the zero level.
When the line crosses above zero, it signals bullish momentum. When it crosses below, it indicates bearish momentum.
This minimalist design makes it easy for traders of all levels to follow.
Because it removes unnecessary complexity, this indicator works well for scalpers and intraday traders.
Its clear signals allow quick reaction to market momentum and reduce confusion caused by traditional MACD histograms or multiple crossover lines.
Free Download
Download the “macd-trad-indicator.mq4” indicator for MT4
Key Features
- Single green signal line for easy interpretation
- Crossing above zero signals a buy opportunity
- Crossing below zero signals a sell opportunity
- Minimalist oscillator with no extreme borders
- Works well with other trend or support/resistance tools
Indicator Chart
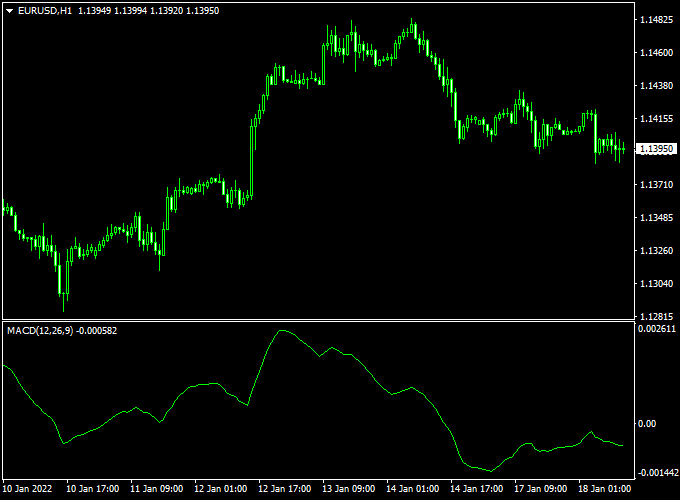
The chart below shows the MACD Signal Oscillator in action.
The green line crossing above zero highlights potential buy trades, while crossing below zero indicates sell trades.
Its clean layout makes it easy to spot signals at a glance without extra chart clutter.

Guide to Trade with MACD Signal Oscillator Indicator
Buy Rules
- Wait for the green signal line to move above the 0.00 level
- Confirm upward momentum using price action or trend direction
- Open a buy trade once the line stabilizes above zero
Sell Rules
- Wait for the green signal line to move below the 0.00 level
- Confirm downward momentum using price action or trend direction
- Open a sell trade once the line stabilizes below zero
Stop Loss
- Place a stop loss just below the previous support low for buys
- Place a stop loss just above the previous resistance high for sells
- For volatile pairs, consider slightly wider stops to avoid premature exits
Take Profit
- Exit when the signal line crosses back over the zero level in the opposite direction
- Use nearby support or resistance as additional exit points
- Partial profits can be taken when price reaches a key level in the trend
- For scalping, aim for small pip targets aligned with the session’s average movement
Practical Tips
- Trade during high-volume sessions for clearer momentum signals
- Wait for the line to settle above or below zero before entering
- Monitor multiple timeframes to confirm trend alignment
- Avoid trading during major economic announcements
Day Trading Strategy: MACD Signal Oscillator + AG Renko Chart Indicator (MT4)
This day trading strategy combines the MACD Signal Oscillator and the AG Renko Chart Indicator on MetaTrader 4 (MT4) to identify high-probability buy and sell opportunities.
The MACD Signal Oscillator provides momentum insights, while the AG Renko Chart Indicator offers trend direction clarity.
This strategy is suitable for day trading on M15 and H1 timeframes.
Buy Entry Rules
- Wait for the MACD Signal Oscillator’s green line to cross above the zero level, indicating bullish momentum.
- Confirm that the AG Renko Chart Indicator displays a blue line, signaling a bullish trend.
- Enter a buy position at the close of the candlestick that confirms both conditions.
- Set a stop loss just below the recent swing low or a fixed number of pips, depending on your risk tolerance.
- Set a take profit target using a risk-to-reward ratio of at least 1:2, or exit when the MACD line crosses below the zero level or the AG Renko line turns red.
Sell Entry Rules
- Wait for the MACD Signal Oscillator’s green line to cross below the zero level, indicating bearish momentum.
- Confirm that the AG Renko Chart Indicator displays a red line, signaling a bearish trend.
- Enter a sell position at the close of the candlestick that confirms both conditions.
- Set a stop loss just above the recent swing high or a fixed number of pips.
- Set a take profit target using a risk-to-reward ratio of at least 1:2, or exit when the MACD line crosses above the zero level or the AG Renko line turns blue.
Advantages
- Combines momentum (MACD) with trend direction (AG Renko) for higher probability trades.
- Reduces market noise, allowing for clearer trade signals.
- Works effectively on M15 and H1 timeframes for day trading.
- Helps in identifying trend reversals and continuations with minimal lag.
Drawbacks
- False signals can occur during ranging or choppy markets, leading to small losses.
- Requires constant monitoring of charts, which can be time-consuming for day traders.
- Not ideal for low-liquidity pairs due to potential slippage and wider spreads.
- Traders need to combine it with proper money management; otherwise, small losses can accumulate quickly.
Case Study 1: EUR/USD M15 Buy
On the EUR/USD M15 chart, the MACD Signal Oscillator’s green line crossed above the zero level, indicating bullish momentum.
The AG Renko Chart Indicator displayed a blue line, confirming a bullish trend.
A buy position was entered at 1.1050.
The stop loss was placed at 1.1030 (-20 pips), and the take profit target was set at 1.1075 (+25 pips).
The price moved upward and hit the take profit level within the session, resulting in a +25 pips gain.
Case Study 2: GBP/USD H1 Sell
During the London session on GBP/USD H1, the MACD Signal Oscillator’s green line crossed below the zero level, indicating bearish momentum.
The AG Renko Chart Indicator showed a red line, confirming a bearish trend.
A sell position was entered at 1.2800.
The stop loss was set at 1.2820 (-20 pips), and the take profit target was 1.2770 (+30 pips).
The price declined steadily and reached the take profit level within the session, resulting in a +30 pips profit.
Strategy Tips
- Use M15 and H1 charts for day trading to capture intraday trends.
- Focus on major currency pairs like EUR/USD, GBP/USD, and USD/JPY for better liquidity.
- Always apply proper risk management with stop losses and take profit targets.
- Test the strategy on a demo account before trading live.
Download Now
Download the “macd-trad-indicator.mq4” indicator for Metatrader 4
FAQ
How does the MACD Signal Oscillator differ from standard MACD?
It uses only one signal line instead of multiple lines or a histogram. This simplifies interpretation and makes it faster to identify trade opportunities.
Which timeframe is best?
M5, M15, and M30 charts work best for intraday trades, while H1 or H4 can be used for swing trading. Adjust your stop loss and take profit according to volatility.
Can this indicator be used on all currency pairs?
Yes. It works effectively on major, minor, and cross pairs. Always check for liquidity and spread before scalping.
Summary
The MACD Signal Oscillator Indicator for MT4 provides a minimalist approach to trading by using a single green line to show momentum changes.
Crosses above zero suggest buying opportunities, while crosses below indicate selling.
This indicator is ideal for scalpers and intraday traders who want quick, actionable signals without clutter.
By combining the oscillator with support/resistance levels, trend analysis, and proper risk management, traders can enter and exit trades confidently while minimizing confusion from traditional MACD signals.


