About the MACD with Awesome Oscillator Indicator
The MACD with Awesome Oscillator (AO) indicator for MT5, also called MACD OA, combines the MACD and Awesome Oscillator to provide both trend direction and reversal signals.
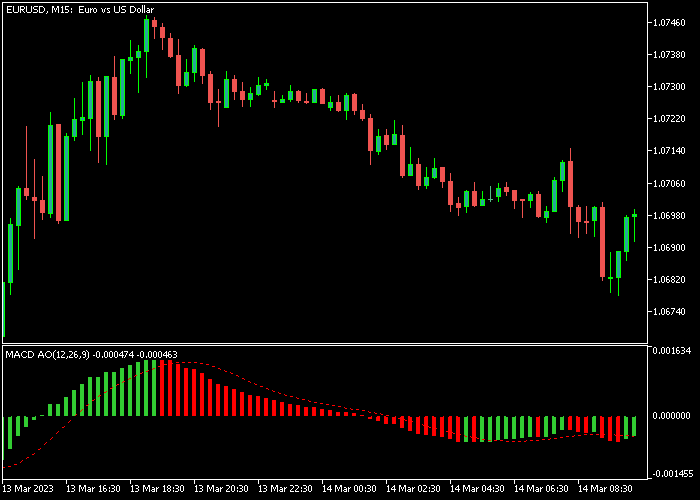
It appears as a colored histogram in a separate chart window, making it easy to spot bullish and bearish market conditions.
When the histogram moves above zero, it signals bullish momentum. Conversely, when it moves below zero, it signals bearish pressure.
The MACD OA can also be combined with moving averages or other trend indicators to confirm market direction and strengthen trading decisions.
All inputs, including MACD fast and slow periods and the applied price type, are fully adjustable to suit your trading style.
Free Download
MACD AO Colors.mq5 Indicator (MT5)
Key Features
- Combines MACD and Awesome Oscillator for trend and reversal signals.
- Displays colored histogram bars for easy identification of market momentum.
- Signals bullish trends above zero and bearish trends below zero.
- Customizable MACD fast and slow periods and applied price.
- Can be combined with moving averages and other trend indicators.
Indicator Chart
The MACD OA indicator appears in a separate window below the main chart.
Histogram bars above zero signal bullish momentum, while bars below zero signal bearish momentum.
Crosses of the zero line are used as entry and exit triggers for trades.

Guide to Trade with MACD with Awesome Oscillator
Buy Rules
- Enter a buy trade when the histogram crosses back above zero from below.
- Confirm that momentum aligns with an upward price move.
- Wait for a clear histogram bar above zero before entering the trade.
- Use additional support levels to time the entry for more accuracy.
Sell Rules
- Enter a sell trade when the histogram crosses back below zero from above.
- Confirm that momentum aligns with a downward price move.
- Wait for a clear histogram bar below zero before entering the trade.
- Use nearby resistance levels to help refine the timing of the entry.
Stop Loss
- For buy trades, place the stop loss slightly below the nearest support zone or swing low.
- For sell trades, place the stop loss slightly above the nearest resistance zone or swing high.
- Consider trailing the stop behind minor consolidation areas to protect profits while giving the trade room to move.
Take Profit
- Exit buy trades when the histogram crosses back below zero or near the next technical resistance.
- Exit sell trades when the histogram crosses back above zero or near the next technical support.
- Partial profit-taking is recommended near major support/resistance zones.
MACD with Awesome Oscillator Day Trading Strategy for MT5
This strategy combines the MACD with Awesome Oscillator indicator with the Supertrend indicator to build a day trading system based on trend direction and momentum confirmation.
The Supertrend indicator defines the main market direction.
A green Supertrend line indicates a bullish trend, while a red line indicates bearish conditions.
The MACD with Awesome Oscillator component measures momentum strength.
A histogram crossing above the zero line signals increasing bullish momentum, while a cross below zero signals bearish momentum.
This strategy works best on M15 and H1 charts during the London and US sessions.
It is suitable for major forex pairs such as EURUSD, GBPUSD, USDJPY, and EURJPY where directional movement is clearer during active market hours.
Buy Entry Rules
- Wait for the Supertrend line to turn green indicating a bullish trend.
- Confirm that the MACD histogram crosses above the zero line.
- Enter a buy trade at the opening of the next candle after confirmation.
- Place stop loss below the Supertrend line or below the most recent swing low, depending on volatility conditions.
- Close the trade when the Supertrend turns red or when the MACD histogram crosses back below zero.
Sell Entry Rules
- Wait for the Supertrend line to turn red indicating a bearish trend.
- Confirm that the MACD histogram crosses below the zero line.
- Enter a sell trade at the opening of the next candle after confirmation.
- Place stop loss above the Supertrend line or above the most recent swing high, depending on market volatility.
- Close the trade when the Supertrend turns green or when the MACD histogram crosses back above zero.
Case Study 1
On EURUSD H1 during the London session, the Supertrend line turned green after a consolidation phase, signaling a bullish trend shift.
Shortly after, the MACD histogram crossed above the zero line, confirming upward momentum.
A buy trade was entered at the next candle open.
Price moved upward steadily and stayed above the Supertrend line throughout the move.
About 12 hours later, the Supertrend line switched to red, and the long trade was closed at that moment.
Case Study 2
On USDJPY M15 during the US session, the Supertrend line turned red after a rejection from resistance, indicating bearish conditions.
Shortly after, the MACD histogram crossed below the zero line, confirming downside momentum.
A sell trade was entered at the next candle open.
Price moved lower with consistent structure and remained below the Supertrend line.
About 8 hours later, the Supertrend line turned green, and the short trade was closed at that moment.
Download Now
MACD AO Colors.mq5 Indicator (MT5)
FAQ
How does the MACD OA indicator generate signals?
The indicator uses the combined MACD and Awesome Oscillator histogram.
Crosses above zero indicate bullish momentum, and crosses below zero indicate bearish momentum.
Can the input settings be adjusted?
Yes. Users can modify the MACD fast and slow periods and the applied price type to adjust sensitivity and match different trading strategies.
How should stop loss and take profit be set?
Stop loss can be placed near support/resistance zones, swing points, or volatility-based levels.
Take profit can follow opposite zero line signals, key levels, or a predefined reward-to-risk ratio.
Summary
The MACD with Awesome Oscillator indicator simplifies trend and reversal detection by combining two powerful technical tools.
Histogram bars clearly show bullish and bearish momentum, while customizable settings allow for flexible trading across multiple timeframes.
Using dynamic or support/resistance-based stop losses along with clearly defined take profit rules helps manage risk effectively and capture trend moves with confidence.


