About the Murrey Math Indicator
The Murrey Math Indicator for MT5 applies the principles of Gann analysis to identify significant support and resistance levels in the market.
These levels help traders anticipate price reversals, trend continuations, and potential breakout zones.
The most notable levels include 0/8, 1/8, 2/8, 3/8, 4/8, 5/8, 6/8, 7/8, and 8/8, which represent critical areas where price often reacts.
This tool can be used to plan entries, exits, and manage stop loss or take profit levels effectively.
Traders can customize inputs such as the calculation period (P) and step-back settings to align the indicator with their strategy.
The Murrey Math Indicator can serve as a standalone trading tool or be combined with other technical indicators to confirm trends and improve trade accuracy.
Free Download
murrey_math.mq5 Indicator (MT5)
Key Features
- Identifies key support and resistance levels using Gann-based calculations.
- Plots important Murrey Math levels (0/8 to 8/8) on the chart.
- Helps plan entries, exits, stop losses, and take profit levels.
- Customizable calculation period and step-back settings.
- Can be used standalone or with other indicators to confirm trends.
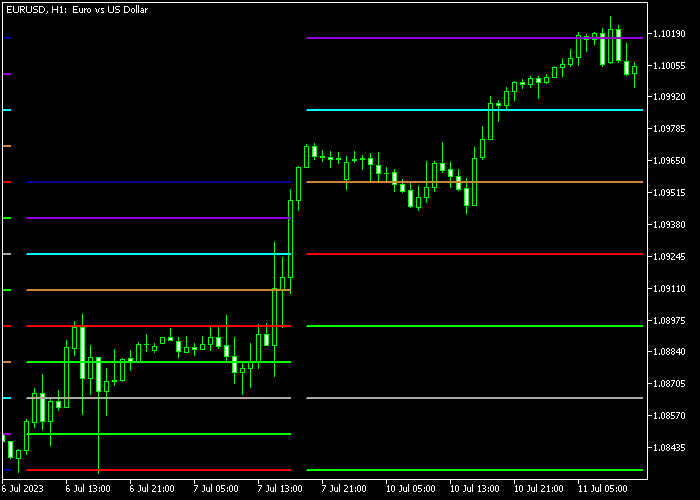
Indicator Chart
The Murrey Math Indicator plots horizontal lines representing key levels directly on the main chart.
Traders can observe price interaction with these levels to gauge potential reversals or continuation of trends.
Levels such as 0/8, 4/8, and 8/8 often act as strong support or resistance, while intermediate levels guide partial retracements and intraday setups.
The chart helps traders plan trades with precision and confidence.

Guide to Trade with Murrey Math Indicator
Buy Rules
- Enter a buy trade when price bounces off a strong support level (e.g., 0/8 or 2/8).
- Confirm upward momentum near intermediate levels (e.g., 3/8 or 4/8).
- Look for price closing above a Murrey Math support level to validate a buy signal.
- Follow subsequent reactions to consecutive levels for trend continuation.
Sell Rules
- Enter a sell trade when price reverses from a strong resistance level (e.g., 6/8 or 8/8).
- Confirm downward momentum near intermediate levels (e.g., 5/8 or 4/8).
- Look for price closing below a Murrey Math resistance level to validate a sell signal.
- Follow subsequent reactions to consecutive levels for trend continuation.
Stop Loss
- Place stops slightly beyond the nearest Murrey Math support for buy trades.
- Place stops slightly beyond the nearest Murrey Math resistance for sell trades.
- Adjust stops according to volatility and recent swing highs/lows.
Take Profit
- Close buy trades near the next Murrey Math resistance level.
- Close sell trades near the next Murrey Math support level.
- Optionally, trail take profits along successive levels for trend-following trades.
Murrey Math Forex Indicator Day Trading Strategy for MT5
This day trading strategy combines the Murrey Math Forex Indicator and the EMA Levels Forex Indicator to capture intraday reversals with trend confirmation.
The Murrey Math Indicator identifies strong support and resistance levels, generating buy signals when price bounces off levels like 0/8 or 2/8 and sell signals when price reverses from levels like 6/8 or 8/8.
The EMA Levels Indicator confirms trend direction with thick green and orange lines.
This strategy focuses on trading reversals at significant price levels while aligning entries with the current trend.
It works well on M15 and H1 charts, especially during active sessions on major currency pairs and GOLD.
Buy Entry Rules
- Wait for price to bounce off a strong Murrey Math support level, such as 0/8 or 2/8.
- Confirm a bullish trend with the EMA Levels Indicator showing a thick green line.
- Enter a buy trade at the opening of the next candle.
- Place stop loss slightly below the support level.
- Take profit at the next Murrey Math resistance level or if the EMA line turns orange, signaling a trend reversal.
Sell Entry Rules
- Wait for price to reverse from a strong Murrey Math resistance level, such as 6/8 or 8/8.
- Confirm a bearish trend with the EMA Levels Indicator showing a thick orange line.
- Enter a sell trade at the opening of the next candle.
- Place stop loss slightly above the resistance level.
- Take profit at the next Murrey Math support level or if the EMA line turns green, indicating a trend reversal.
Case Study 1
On EURUSD M15, price approached the 2/8 Murrey Math support level and formed a bounce, signaling a buy opportunity.
The EMA Levels Indicator showed a thick green line, confirming the bullish trend.
A buy trade was entered at the next candle open with stop loss placed just below the support level.
Price moved upward steadily, respecting the trend.
The trade was closed for 31 pips profit when price reached the 6/8 resistance level, capturing a strong intraday reversal.
Case Study 2
On GBPUSD H1, price reversed near the 8/8 Murrey Math resistance level, generating a sell signal.
The EMA Levels Indicator confirmed the bearish trend with a thick orange line.
A sell trade was opened at the next candle with stop loss placed above the resistance level.
Price moved downward consistently during the session.
The position was closed when price reached the 2/8 support level, completing a clear trend-aligned reversal.
Download Now
murrey_math.mq5 Indicator (MT5)
FAQ
How do I interpret the Murrey Math levels?
Levels like 0/8, 4/8, and 8/8 are typically strong support or resistance zones.
Price reactions at these levels indicate potential reversals or breakouts.
Can I use this indicator for intraday trading?
Yes. It works well for short-term trading, helping to identify pivot points and key levels where price may react within a single session.
Is it adjustable for different market conditions?
Absolutely. You can modify the calculation period and step-back settings to fit volatility and trading style, making it flexible across Forex, stocks, or indices.
Should Murrey Math be combined with other tools?
While it can be used on its own, combining it with trend indicators, momentum oscillators, or volume analysis often improves signal reliability and trade timing.
Summary
The Murrey Math Indicator maps key support and resistance levels, giving traders insight into where price may pause, reverse, or continue.
Its Gann-based framework helps identify strategic entry and exit points.
Customizable settings allow adaptation to different timeframes, instruments, and trading styles.
Whether applied for intraday scalping, swing trades, or trend analysis, it serves as a versatile tool to enhance decision-making and improve trade planning.


