
About the NRTR Indicator
The NRTR (Nick Rypock Trailing Reverse) Indicator for MT5 is a reliable trading system that generates non-repaint buy and sell signals using colored dots plotted directly on the price chart.
Blue dots indicate bullish signals, while red dots indicate bearish signals.
These dots can also act as dynamic trailing stop loss levels, allowing traders to adjust stops along with price movement.
NRTR is highly versatile and works on any timeframe or trading instrument.
The indicator is fully customizable, letting users modify the period and dot colors to fit individual trading preferences.
NRTR can function as a standalone tool or to confirm signals from other strategies.
Free Download
Key Features
- Displays blue dots for buy signals and red dots for sell signals.
- Non-repaint signals ensure reliability and confidence in trades.
- Dots act as trailing stop loss levels to protect profits.
- Customizable period and dot colors to match your trading style.
- Can be used standalone or alongside other indicators.
Indicator Chart
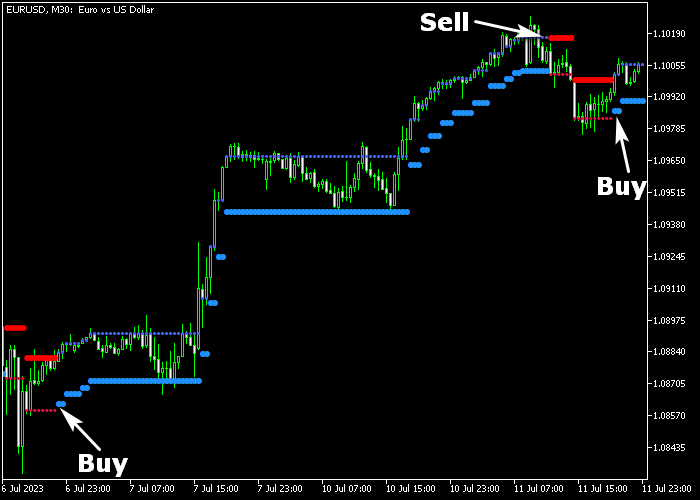
The NRTR indicator plots on the main price window with blue and red dots representing buy and sell signals.
Blue dots suggest bullish momentum, while red dots indicate bearish momentum.
Traders can follow these signals for entries, exits, and adjusting trailing stops.
The indicator’s ability to act as both a signal generator and a trailing stop makes it a versatile tool for intraday and swing strategies.
Guide to Trade with the NRTR Indicator
Buy Rules
- Wait for a blue NRTR dot to appear signaling a bullish reversal.
- Confirm the uptrend using swing support or other trend indicators.
- Enter a buy market order after the dot forms.
- Align trades with short-term bullish momentum for intraday or swing trading.
Sell Rules
- Wait for a red NRTR dot to appear signaling a bearish reversal.
- Confirm the downtrend using swing resistance or other trend indicators.
- Enter a sell market order after the dot forms.
- Align trades with short-term bearish momentum for intraday or swing trading.
Stop Loss
- For buy trades, place the stop loss a few pips below the blue NRTR dot.
- For sell trades, place the stop loss a few pips above the red NRTR dot.
- Use the trailing NRTR dots to gradually adjust stops as the trend develops.
Take Profit
- Exit buy trades when a red dot appears or at a fixed profit target.
- Exit sell trades when a blue dot appears or at a fixed profit target.
- Optionally trail take profits along NRTR dot levels for trend-following trades.
- Maintain a minimum risk-to-reward ratio of 2:1 for all trades.
NRTR Indicator Day Trading Strategy for MT5
This day trading strategy combines the NRTR Indicator and the Indicator Arrows Alert to trade with clear trend direction and precise entry timing.
The NRTR Indicator acts as the trend filter by plotting blue and red dots that follow price and flip when the trend changes.
This makes it effective for identifying market direction and potential reversals.
The Indicator Arrows Alert provides simple buy and sell signals using colored arrows.
By combining both tools, this strategy focuses on trading only in the direction of the dominant trend while using arrows for confirmation.
Buy Entry Rules
- Wait for the NRTR Indicator to show blue dots, confirming a bullish trend.
- Look for a green arrow from the Indicator Arrows Alert.
- Enter a buy trade at the opening of the next candle.
- Place stop loss below the most recent swing low or below the NRTR level.
- Take profit when a red arrow appears or when the NRTR flips to red.
Sell Entry Rules
- Wait for the NRTR Indicator to show red dots, confirming a bearish trend.
- Look for a red arrow from the Indicator Arrows Alert.
- Enter a sell trade at the opening of the next candle.
- Place stop loss above the most recent swing high or above the NRTR level.
- Take profit when a green arrow appears or when the NRTR flips to blue.
Case Study 1
During the London session on EURUSD M15, the NRTR Indicator maintained blue dots, showing that buyers were in control.
Price pulled back slightly before the Indicator Arrows Alert printed a green arrow.
This created a continuation setup, and a buy trade was opened at the next candle.
Stop loss was placed below the recent pullback low.
Momentum returned to the upside as price pushed higher.
The trade was exited for 32 pips when a red arrow appeared, signaling a shift in momentum.
Case Study 2
On XAUUSD M5 during the New York session, the NRTR Indicator showed red dots above price, confirming a bearish environment.
After a brief consolidation, the Indicator Arrows Alert printed a red arrow.
A sell trade was taken at the next candle open with the stop loss placed above the recent high.
Price moved lower with strong volatility.
Unfortunately, the short position was closed for a small loss when a green arrow appeared, indicating a possible trend reversal.
Download Now
FAQ
Can NRTR be used on all timeframes?
Yes. The indicator works reliably on any timeframe, from minutes to daily charts.
Is NRTR suitable for all instruments?
Yes. It works on Forex, commodities, indices, stocks, and any instrument available on MT5.
Can the dot colors be customized?
Yes. Traders can set their preferred colors for bullish (blue) and bearish (red) signals.
Should NRTR be used alone or with other tools?
It works well as a standalone indicator, but combining it with trend or support/resistance tools can improve accuracy.
Summary
The NRTR indicator delivers reliable non-repaint buy and sell signals with trailing stop levels.
Blue dots signal bullish momentum, red dots signal bearish momentum.
NRTR provides clear trading signals and simple rules for entries, exits, and dynamic trend management, making it a valuable tool for any trading strategy.


