The RSI Trend Swings indicator for Metatrader 5 identifies buy and sell swing trading signals based on the RSI technical indicator.
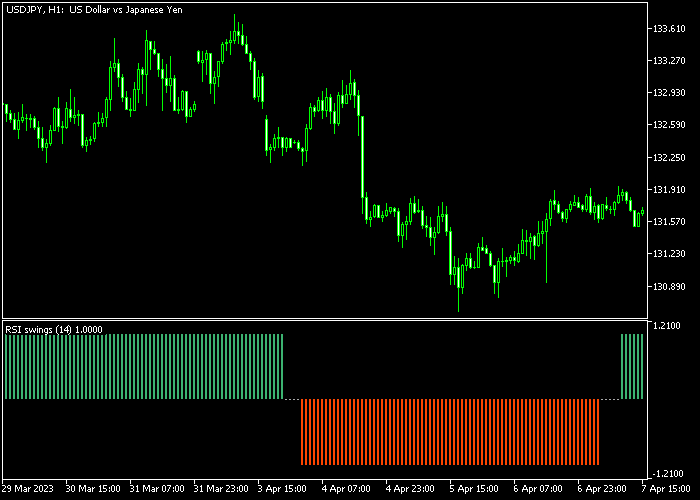
The indicator is displayed as an array of green and red colored histogram bars in a bottom chart.
How can you spot market trends with this RSI based technical indicator?
- Green colored histogram bars are bullish.
- Red colored histogram bars are bearish.
The indicator works for any trading instrument that can be loaded in the Metatrader 5 platform.
Please note that the indicator works for scalping, day trading, and swing trading.
The following indicator inputs and parameters can be modified: RSI period, average period, average method, price, level up, and level down.
Experiment with the risk multiplier settings.
First, familiarize yourself with this technical indicator and test it on a demo account.
It supports all time frames and Forex pairs.
Free Download
Rsi swings.mq5 Indicator (MT5)
Chart Example
The following chart shows what the RSI Trend Swings Forex indicator looks like when applied to the MT5 chart.

How To Buy And Sell Forex Pairs With The RSI Trend Swings Indicator?
Find a simple trading example below:
Buy Signal
- The first green histogram bar is a bullish signal.
- Open a buy trade and set your stop loss below the most recent support area.
- Close the buy trade for a fixed take profit target, or wait for the first red histogram bar.
Sell Signal
- The first red histogram bar is a bearish signal.
- Open a sell trade and set your stop loss above the most recent resistance area.
- Close the sell trade for a fixed take profit target, or wait for the first green histogram bar.


