The SpudFibo indicator for MT4 is a powerful Fibonacci-based trading tool designed to automatically plot intraday support and resistance levels using the Fibonacci sequence.
Unlike basic Fibonacci retracement tools, SpudFibo dynamically updates based on current market structure, offering more reactive and practical trading zones.
Core Features
- Auto-Plotting Fibonacci Levels: No need to manually draw retracements—the indicator does it for you in real-time.
- Daily Pivot Zones: Based on Fibonacci calculations from previous price action highs/lows, showing ideal bounce or breakout points.
- Works on All Timeframes: Especially effective on M15, M30, and H1 charts.
- Color-Coded Levels: Makes it easy to identify strong resistance and support zones at a glance.
Trading Uses
Traders use SpudFibo to identify ideal retracement and extension areas for trade entries and exits.
It is highly effective in trend continuation and reversal setups. Many traders also combine it with candlestick confirmation or other trend indicators.
Free Download
Download the “#SpudFibo.mq4” indicator for MT4
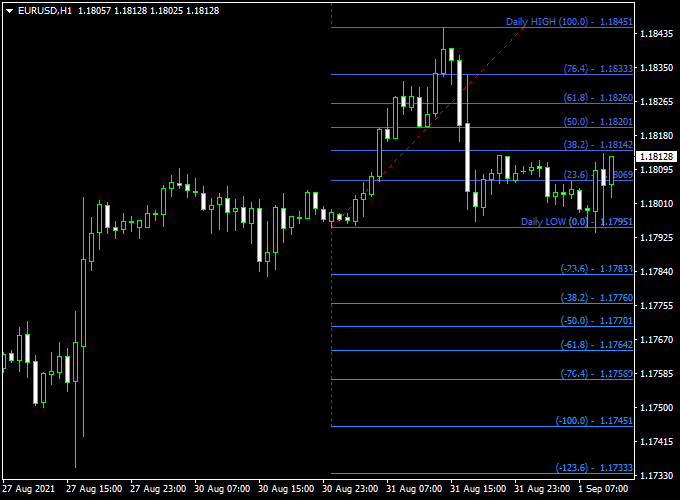
Indicator Example Chart
The EUR/USD 1-hour chart below showcases the SpudFibo Forex indicator in action.

How to trade with it?
In an uptrending market, look to buy the currency pair when the price retraces back towards the 38.2% Fibonacci retracement level.
In a downtrending market, look to sell the currency pair when the price rallies back towards the 38.2% Fibonacci retracement level.
Naturally, feel free to use your favorite trading methods to open and close trades with the SpudFibo Fibonacci Forex indicator.
Indicator Specifications
Trading Platform: Developed for Metatrader 4 (MT4)
Currency pairs: Works for any pair
Time frames: Works for any time frame
Input Parameters: Draw main Fibonacci lines, inner Fibs, color settings & style
Indicator type: Fibonacci
Repaint? Does not repaint the Fibonacci lines.
Download Now
Download the “#SpudFibo.mq4” indicator for Metatrader 4
SpudFibo + Wolfe Waves Metatrader 4 Reversal Strategy
This strategy combines the accuracy of the SpudFibo Fibonacci Forex Indicator with the powerful pattern-detection capabilities of the Wolfe Wave Forex Indicator.
It’s designed to catch high-probability reversal setups near key Fibonacci levels, with confirmation from well-formed Wolfe Wave structures.
Strategy Setup
- Indicator 1: SpudFibo Fibonacci Levels (Support/Resistance based on retracements)
- Indicator 2: Wolfe Wave (Pattern-based reversal entry)
- Timeframes: M15, M30, or H1
- Markets: Major forex pairs, gold, and indices
Buy Trade Rules
- Price pulls back to a strong Fibonacci support level (e.g., 50.0%, 61.8%) plotted by the SpudFibo Indicator.
- A valid bullish Wolfe Wave pattern completes near that Fibonacci zone (5-wave structure with projected EPA line upward).
- Enter a Buy trade once the price breaks above the Wolfe Wave’s corrective wave (Wave 4 → 5 line) or crosses above the EPA projection.
- Place a Stop Loss just below the recent low or below the 78.6% Fibonacci level for protection.
- Set Take Profit at the next key Fibonacci resistance level or at the projected EPA target from the Wolfe Wave.
Sell Trade Rules
- Price rallies to a strong Fibonacci resistance zone (e.g., 61.8%, 78.6%) on the SpudFibo Indicator.
- A bearish Wolfe Wave pattern completes at or near that zone (classic 5-wave formation with a projected downward EPA line).
- Enter a Sell trade when price breaks the Wave 4 → 5 support line or closes below the EPA line.
- Place the Stop Loss above the most recent swing high or just above the 100% Fibonacci level.
- Target the next major support zone or the Wolfe Wave EPA projection line.
Why This Strategy Works
The SpudFibo Indicator highlights areas where price is statistically likely to react.
At the same time, the Wolfe Wave Indicator gives you a structured, pattern-based entry with clearly defined stop and target levels.
Together, they help you catch precise reversals with minimal risk and strong risk-reward ratios.
Final Thoughts
The SpudFibo Fibonacci Forex Indicator for MetaTrader 4 is a versatile tool designed to assist traders in identifying key support and resistance levels based on Fibonacci retracements.
Automatically plotting these levels on your chart helps in pinpointing potential entry and exit points, enhancing your trading strategy.
This indicator is particularly useful for traders employing Fibonacci-based strategies, as it provides clear visual cues for market analysis.
For optimal performance, consider combining the SpudFibo Indicator with other technical analysis tools to confirm signals and improve decision-making.


