
About the Stochastic Indicator with Support & Resistance
The Stochastic Indicator with Support & Resistance is a momentum-based trading tool designed for MetaTrader 5.
It combines the traditional stochastic oscillator with automatically plotted support and resistance levels derived from overbought and oversold conditions.
This approach helps traders identify potential turning points in the market while also highlighting key price levels.
The indicator appears in both the main price area and beneath it.
The main price area displays horizontal support and resistance levels, while the stochastic oscillator below tracks momentum and market exhaustion.
Blue stochastic readings represent overbought conditions, while orange readings indicate oversold market levels.
By combining momentum signals with important price levels, traders gain a practical way to plan entries and exits.
The indicator works particularly well when used alongside a trend-following tool, allowing traders to align stochastic signals with the broader market direction.
Free Download
Stochastic (sr).mq5 Indicator (MT5)
Key Features
- Identifies overbought and oversold levels using the stochastic oscillator.
- Plots automatic support and resistance levels directly in the main price area.
- Displays blue horizontal lines for resistance and orange horizontal lines for support.
- Uses color-coded stochastic signals to highlight market extremes.
- Helps traders combine momentum analysis with key price levels.
- Includes adjustable settings such as stochastic period, slowing period, and signal period.
- Allows customization of level settings including 80.0 for overbought and 20.0 for oversold.
- Works effectively when combined with trend-following indicators.
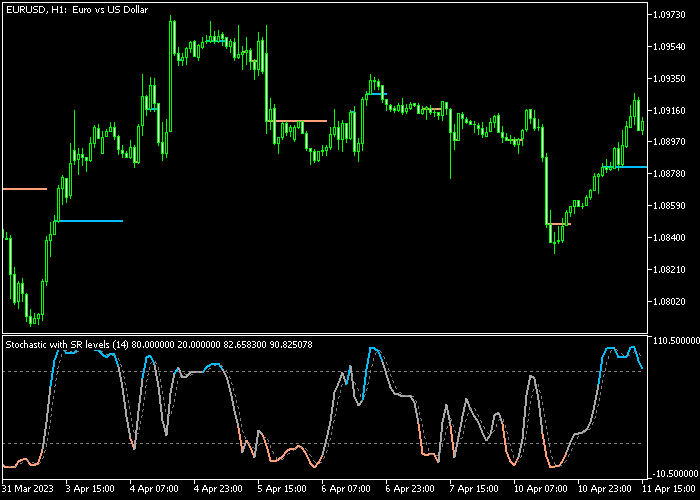
Indicator Chart
The Stochastic Indicator with Support & Resistance highlights potential trading opportunities by combining momentum signals with price levels.
The main price area displays blue and orange horizontal levels that mark resistance and support zones.
Beneath it, the stochastic oscillator changes color to show overbought and oversold conditions, helping traders spot possible buy and sell setups aligned with market momentum.
Guide to Trade with Stochastic Indicator with Support & Resistance
Buy Rules
- Wait for the orange stochastic line to appear in the indicator area, showing an oversold market condition.
- Confirm that the overall market trend is moving upward before entering a trade.
- Open a buy position once price reacts near the support level displayed in the main price area.
- Monitor the stochastic movement and manage the position while momentum begins to recover.
Sell Rules
- Wait for the blue stochastic line to appear in the indicator area, indicating an overbought market condition.
- Confirm that the broader trend direction is downward before opening a position.
- Open a sell trade when price approaches the resistance level displayed in the main price area.
- Watch for weakening momentum as the stochastic begins to turn lower.
Stop Loss
- Place the stop loss approximately 3 pips below the most recent support level for buy trades.
- For sell trades, place the stop loss about 3 pips above the nearest resistance level.
- Never place the stop loss directly at the level line to avoid premature stop-outs.
Take Profit
- Close buy positions when the stochastic line turns blue and crosses into overbought territory.
- Close sell positions when the stochastic line turns orange and reaches oversold territory.
- Traders may also scale out of positions as momentum begins to reverse.
Price Pullback Day Trading Strategy for MT5
This day trading strategy combines the Stochastic Indicator with Support Resistance with the ADX VMA Indicator to create a balanced system that captures reversals within strong trends.
The Stochastic Indicator with Support Resistance helps identify overbought and oversold conditions while also highlighting key levels where price is likely to react.
When the orange stochastic line reaches oversold territory, it suggests that price may be ready to move upward.
When the blue stochastic line reaches overbought levels, it signals that price may be ready to turn lower.
This makes it useful for timing entries during pullbacks.
The ADX VMA Indicator confirms whether the market has enough strength to support a trade.
A green histogram indicates a bullish trend with strong momentum.
A violet histogram indicates a bearish trend with sustained selling pressure.
This strategy blends reversal timing with trend strength, helping traders enter trades at better prices while staying aligned with the dominant market direction.
Buy Entry Rules
- Wait for the ADX VMA Indicator to show a green histogram, confirming bullish trend strength.
- Wait for the orange stochastic line to move into oversold territory and begin turning upward.
- Enter a buy trade at the close of the confirmation candle.
- Place a stop loss below the nearest support level or recent swing low.
- Take profit when the stochastic reaches overbought levels or when the histogram turns violet.
Sell Entry Rules
- Wait for the ADX VMA Indicator to show a violet histogram, confirming bearish trend strength.
- Wait for the blue stochastic line to move into overbought territory and begin turning downward.
- Enter a sell trade at the close of the confirmation candle.
- Place the stop loss above the nearest resistance level or recent swing high.
- Take profit when the stochastic reaches oversold levels or when the histogram turns green.
Case Study 1: EURUSD M15 Buy Setup
On EURUSD M15, the ADX VMA Indicator showed a consistent green histogram, confirming that the market was trending upward with solid momentum.
During a pullback, the orange stochastic line moved into oversold territory and started to turn upward, signaling that the correction was losing strength.
A buy trade was entered at the close of the confirmation candle as price began to move higher again.
The stop loss was placed below the recent swing low and slightly under a visible support level to protect against deeper retracements.
Price resumed its upward movement and formed higher highs.
The trade was closed when the stochastic reached overbought conditions and momentum started to slow.
Case Study 2: GBPUSD H1 Sell Setup
On GBPUSD H1, the ADX VMA Indicator displayed a steady violet histogram, confirming a strong bearish trend.
Price pulled back toward a resistance area while the blue stochastic line moved into overbought territory and began turning downward.
A sell trade was entered at the close of the confirmation candle as bearish pressure returned.
The stop loss was placed above the recent swing high and just above the resistance zone to allow room for normal volatility.
The short trade was closed when the stochastic reached oversold levels and the downward momentum started to weaken.
Download Now
Stochastic (sr).mq5 Indicator (MT5)
FAQ
What makes this stochastic indicator different from the standard version?
This version integrates automatic support and resistance levels directly into the main price area.
These levels are calculated from stochastic overbought and oversold conditions, which helps traders connect momentum signals with key price zones.
What are the default indicator settings?
The indicator typically uses a stochastic period of 14 along with adjustable slowing and signal periods.
It also includes level settings at 80 for overbought and 20 for oversold conditions, which traders can modify depending on their strategy.
Which trading strategy works best with this indicator?
The indicator performs best when combined with a trend-following tool such as a moving average or trend filter.
This approach allows traders to take stochastic signals that align with the dominant market direction.
Summary
The Stochastic Indicator with Support & Resistance offers a practical combination of momentum analysis and price level identification.
By integrating stochastic signals with automatically generated support and resistance zones, it helps traders locate potential reversal points and manage trades more effectively.
The color-coded oscillator highlights overbought and oversold conditions, while the horizontal levels provide logical areas for entries, stop loss placement, and profit targets.
This combination makes the indicator useful for traders who prefer momentum-based strategies supported by key price levels.
When used alongside a trend-following indicator, the tool can improve timing and reduce low-probability trades.
With customizable parameters and straightforward signals, it fits both beginner and experienced traders looking for a structured approach to market analysis.


