
About the SVE Bollinger Band MTF Indicator
The SVE Bollinger Band MTF indicator for MetaTrader 4 is a signal-based trading tool that identifies potential buy and sell opportunities when price reaches extreme Bollinger Band conditions.
It is designed to help traders spot exhaustion points where price is likely to react or reverse.
The indicator operates in a separate MT4 window and generates arrow signals based on predefined Bollinger Band levels.
A blue arrow signals a potential buy opportunity, while a red arrow highlights a potential sell setup.
These signals are generated when the indicator crosses specific threshold levels, making them easy to spot and follow.
SVE Bollinger Band MTF supports multi-timeframe analysis, allowing traders to align lower timeframe entries with higher timeframe conditions.
It performs best when combined with a trend-following filter, such as the 100 EMA, to ensure trades are taken in the dominant market direction.
Free Download
Download the “sve bollinger band (mtf + alerts + arrows + divergence).ex4” MT4 indicator
Key Features
- Generates buy and sell signals based on Bollinger Band extremes.
- Displays signals in a separate MT4 window.
- Supports multi-timeframe market analysis.
- Works on all currency pairs and timeframes.
- Designed to be used with trend confirmation tools.
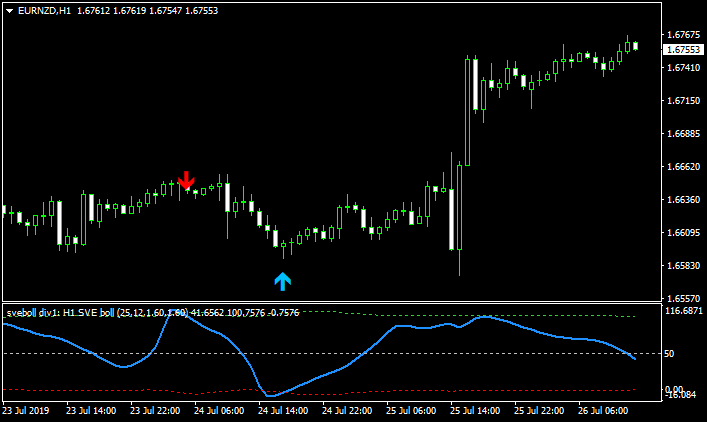
Indicator Chart
This chart example shows the SVE Bollinger Band MTF indicator plotted below the main price chart.
The window displays blue and red arrows that mark buy and sell signals when extreme Bollinger Band levels are reached and momentum shifts back toward the mean.
Guide to Trade with SVE Bollinger Band MTF Indicator
Buy Rules
- Confirm that price is trading above the 100 EMA on the chart.
- Wait for a blue buy arrow to appear in the indicator window.
- Ensure the signal occurs after the indicator crosses back above the 0.00 level.
- Open a buy trade at the start of the next candle.
Sell Rules
- Confirm that price is trading below the 100 EMA on the chart.
- Wait for a red sell arrow to appear in the indicator window.
- Ensure the signal occurs after the indicator crosses back below the 117 level.
- Open a sell trade at the start of the next candle.
Stop Loss
- Place the stop loss 3 pips below the most recent swing low for buy trades.
- Place the stop loss 3 pips above the most recent swing high for sell trades.
- Keep the stop loss outside recent consolidation zones.
Take Profit
- Use a fixed take profit target of your preference.
- Close the trade if an opposite colored arrow appears on the chart.
SVE Bollinger MTF Indicator & AMA Signals Forex Day Trading Strategy
This strategy combines the SVE Bollinger Band MTF MT4 Indicator and the AMA Signals MT4 Indicator.
The SVE Bollinger MTF indicator prints blue arrows for buy signals and red arrows for sell signals based on multi-timeframe Bollinger Bands.
The AMA Signals indicator shows trend strength with blue dots indicating a bullish trend and brown dots indicating a bearish trend.
This strategy is designed for day trading on M5, M15, and H1 charts.
By combining entry points from the Bollinger arrows with trend confirmation from the AMA dots, traders can enter trades that follow the dominant intraday trend.
The MTF nature of the Bollinger indicator helps to reduce noise, while the AMA dots provide a simple but effective trend filter.
Buy Entry Rules
- The AMA Signals indicator must show blue dots, confirming a bullish trend.
- The SVE Bollinger Band MTF must produce a blue arrow, signaling a buy.
- Enter long at the close of the candle where the blue arrow appears, if AMA dots remain blue.
- Set a stop loss below a recent swing low or below the lower Bollinger band on the same timeframe.
- Take profit at a defined target level (e.g., pivot resistance, recent high), or trail your stop using the Bollinger bands or AMA dots.
Sell Entry Rules
- The AMA Signals indicator must show brown dots, confirming a bearish trend.
- The SVE Bollinger Band MTF must produce a red arrow, signaling a sell.
- Enter short at the close of the candle where the red arrow appears, if AMA dots remain brown.
- Set a stop loss above a recent swing high or above the upper Bollinger band on the same timeframe.
- Take profit at a defined target level (e.g., pivot support, recent low), or trail your stop using the Bollinger bands or AMA dots.
Advantages
- Multi‑timeframe Bollinger arrows filter noise and improve signal quality.
- AMA dots provide a clear and visual trend filter.
- Flexible exit options: fixed targets, trailing stops using bands or trend dots.
- Works well on several timeframes (M5, M15, H1) for intraday trading.
- Suitable for trend‑following traders who still want precise entry timing.
Drawbacks
- Arrows may lag in very fast price moves, potentially delaying entries.
- AMA dots might flip too late in choppy market conditions.
- Trailing stops may be hit prematurely if the price whipsaws around the Bollinger bands.
- Requires active management of stop losses and exits during the day.
- Less effective on very low volatility days or illiquid pairs.
Example 1 – EURUSD (M5)
During the London–New York overlap, AMA Signals showed persistent blue dots.
The SVE Bollinger MTF indicator printed a blue arrow on the M5 chart.
A long trade was entered, with a stop loss placed just under the recent swing low.
Price continued to climb, and the position was closed when a red Bollinger arrow formed or AMA dots began to change color, locking in a solid intraday profit.
Example 2 – GBPJPY (M15)
On GBPJPY M15, the AMA Signals turned brown, confirming a bearish trend.
Later, a red arrow from the SVE Bollinger MTF indicator appeared, signaling a sell entry.
A short trade was opened, a stop loss was placed above the recent swing high, and the trade target was around the next support level.
The price declined, and the trade was closed when AMA dots started showing blue or when a reversal arrow formed.
Example 3 – AUDNZD (H1)
On AUDNZD H1, AMA Signals turned blue early in the session.
The SVE Bollinger MTF indicator then gave a blue arrow on a pullback.
A long trade was taken, a stop loss was placed under the hour’s swing low, and a longer-term target was identified at a resistance level.
The trade remained open for several candles and was closed when the AMA dots flipped brown or a red Bollinger arrow appeared.
Strategy Tips
- Use higher-volume sessions like London and New York to maximize the effectiveness of arrows and trend dots.
- Confirm your entry with an additional filter (like pivot levels or support/resistance) when signals appear near major price zones.
- Avoid entering trades when the AMA dots are very close to flipping or are inconsistent.
- Use a trailing stop on profitable trades to lock in gains without exiting too early.
- Manage risk by limiting one trade per pair at a time and adjusting position size based on the average true range or daily volatility.
- Backtest the strategy on historical data for each currency pair to find the pair/timeframe combinations that work best for you.
Download Now
Download the “sve bollinger band (mtf + alerts + arrows + divergence).ex4” Metatrader 4 indicator
FAQ
What does the multi-timeframe feature do?
The multi-timeframe option allows the indicator to reference higher timeframe data, helping traders align entries with broader market conditions.
Why is the 100 EMA recommended?
The 100 EMA helps define the overall trend so that trades are only taken in the dominant market direction.
Can this indicator be used without a trend filter?
It can be used alone, but results are typically more consistent when trades follow the prevailing trend.
Does the SVE Bollinger Band MTF repaint signals?
Signals remain fixed once the candle closes, reducing uncertainty during live trading.
Summary
The SVE Bollinger Band MTF MT4 indicator provides traders with precise buy and sell signals based on extreme Bollinger Band conditions.
Its arrow-based output makes it easy to interpret, even during fast-moving markets.
When combined with a trend-following tool such as the 100 EMA, the indicator helps filter out low-probability trades and improves overall trade selection.
It is best suited for traders who want disciplined, rule-based entries aligned with the broader market trend.


