About the Symbol Comparison Indicator
The Symbol Comparison Indicator is a specialized tool for MT5 designed to overlay two different financial instruments within the same chart window.
This functionality allows traders to observe the price action of a secondary asset relative to the primary one without switching between multiple tabs.
By visualizing how two currency pairs or assets move in tandem or opposition, you can pinpoint lead-lag relationships and potential market shifts before they fully materialize.
It is particularly useful for correlation trading strategies where the strength or weakness of one currency impacts another.
Using this indicator helps in identifying when a pair is overextended or lagging behind its correlated counterpart, providing a deeper level of market context that a single price chart cannot offer.
Free Download
Key Features
- Dual symbol visualization allows for real-time correlation analysis on a single screen.
- Adjustable scale fix parameters ensure both symbols are framed correctly for clear comparison.
- Works across all asset classes including Forex, commodities, and indices.
- Simplified interface focuses on price movement rather than complex technical overlays.
- Customizable colors and symbol inputs to match individual trading preferences.
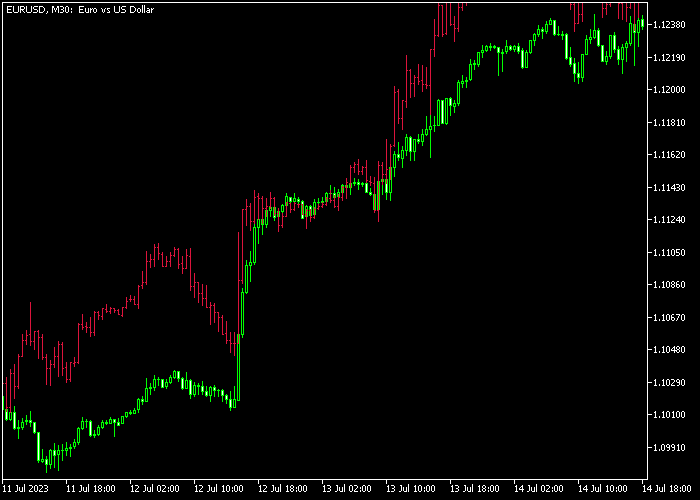
Indicator Chart
The chart displays the primary price action alongside a secondary symbol represented by a colored line.
This setup allows you to see how the two assets interact at specific price levels and during high volatility periods.
When the lines move together, it confirms a strong correlation, while a divergence often suggests a potential reversal or a catch-up move in the lagging asset.

Guide to Trade with Symbol Comparison Indicator
Buy Rules
- Monitor the secondary symbol for a breakout above a key resistance level while the primary pair remains flat.
- Wait for the primary pair to follow the direction of the secondary asset with a bullish candle.
- Confirm that the overall trend direction on higher timeframes aligns with this upward momentum.
- Open a long position once both symbols show synchronized movement to the upside.
Sell Rules
- Identify a sharp decline in the correlated secondary symbol while the primary pair is still at highs.
- Look for the primary pair to break its immediate support level following the lead of the second symbol.
- Check for bearish price action signals such as an engulfing pattern on the primary chart.
- Execute a short trade when the divergence closes and both instruments trend downward together.
Stop Loss
- Place the stop loss above the recent swing high for sell trades to protect against sudden spikes.
- For buy entries, set the stop loss below the most recent support zone or swing low.
- Adjust the exit point based on the volatility of the specific currency pairs being compared.
- Maintain a disciplined approach by exiting if the correlation between the two symbols breaks down unexpectedly.
Take Profits
- Target the next major horizontal support or resistance level identified on the daily or four-hour chart.
- Consider closing half of the position when the primary asset reaches a 1:2 risk-to-reward ratio.
- Use a trailing stop to lock in gains as the two symbols move further in your favor.
- Exit the full position if the secondary symbol begins to show signs of a trend exhaustion or reversal.
Download Now
FAQ
How do I change the secondary symbol in the settings?
You can change the symbol by accessing the indicator inputs and typing the exact name of the asset as it appears in your Market Watch.
Make sure the symbol is visible in the Market Watch window for the indicator to pull the data correctly.
Can I compare more than two symbols at once?
This specific version is optimized for comparing two symbols to keep the analysis focused.
To compare additional instruments, you can apply a second instance of the indicator to the chart with different symbol settings and colors.
Does the indicator work on non-Forex assets like Gold or Oil?
Yes, the indicator is versatile and works with any instrument available on your MT5 platform.
It is frequently used by traders to compare Gold against the USD or Oil against CAD to find market correlations.
Why do the two lines sometimes overlap too closely?
This usually happens if the scale fix setting is not adjusted to account for the price difference between assets.
You can modify the vertical shift or scale parameters in the settings to create a more readable gap between the symbols.
Summary
The Symbol Comparison Indicator is a practical addition for any trader focusing on intermarket analysis and correlation.
It eliminates the need for complex multi-window setups by bringing essential data into one focused view.
While it does not provide automated signals, its ability to highlight divergences and leading movements makes it a valuable asset for manual strategy execution.
Traders looking to improve their market timing will find this tool helpful in identifying which pairs are leading the market and which are likely to follow.


