
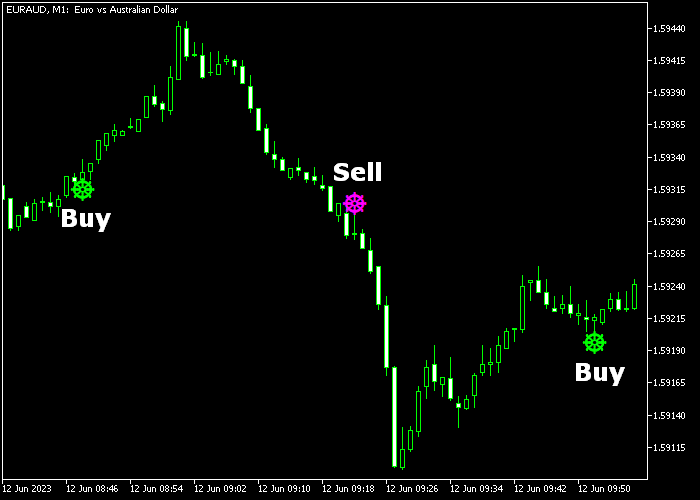
About the Total Power Signal Indicator
The Total Power Signal Indicator for MT5 is a trend reversal tool that prints colored arrows directly on the price chart.
It applies a proprietary calculation to determine when bullish or bearish pressure takes control of the market.
When a green arrow appears, it indicates a potential upward shift in momentum.
When a magenta arrow forms, it signals possible downside continuation.
The arrows are generated at key turning points, helping traders react to fresh trend movements instead of chasing late entries.
You can modify the period, arrow colors, and signal width to suit your chart layout and trading preferences.
The indicator is particularly active during high-volume sessions.
Free Download
Total_Power_Indicator_Signal.mq5 Indicator (MT5)
Key Features
- Arrow-based buy/sell reversal signals.
- Green arrows indicate bullish momentum shifts.
- Magenta arrows indicate bearish momentum shifts.
- Customizable period setting to adjust signal frequency.
- Editable arrow size and colors.
- Designed for fast-paced intraday conditions.
- Performs strongly during London and New York sessions.
Indicator Chart
The Total Power Signal Indicator displays green and magenta arrows on the main price window.
A green arrow marks a potential bullish reversal, while a magenta arrow highlights a possible bearish shift.
Traders use these arrows to time entries in the direction of the emerging move.
Guide to Trade with Total Power Signal Indicator
Buy Rules
- Wait for a green arrow to appear on the price chart.
- Confirm that the arrow forms after a short pullback or consolidation.
- Enter a buy trade at the close of the signal candle.
- Focus on setups during active trading sessions.
Sell Rules
- Wait for a magenta arrow to appear on the price chart.
- Confirm that the arrow forms after a short upward correction.
- Enter a sell trade at the close of the signal candle.
- Prioritize signals during high liquidity hours.
Stop Loss
- For buy trades, place the stop below the nearest support level.
- For sell trades, place the stop above the nearest resistance level.
- Consider session volatility when defining stop distance.
- Ensure the potential reward justifies the defined risk before entering.
Take Profit
- Close buy trades when a magenta arrow appears.
- Close sell trades when a green arrow appears.
- Optionally scale out partial profits at a fixed reward-to-risk ratio.
- Use the opposite arrow as the primary exit trigger.
Total Power Signal Forex Scalping Strategy for MT5
This strategy combines the Total Power Signal indicator with the Force MACD Signal indicator to create a fast and reliable scalping approach for M1 and M5 charts.
The Total Power Signal indicator provides clear directional entries through arrow signals, while the Force MACD Signal indicator confirms the underlying momentum using histogram strength.
This combination helps filter weak trades and focus only on setups where both direction and momentum align.
It works well for traders who prefer quick decisions and short holding times during active market sessions.
The strategy focuses on following immediate price direction while using momentum confirmation to avoid false entries.
It performs best during high liquidity periods when price moves cleanly and reacts quickly to shifts in buying or selling pressure.
Buy Entry Rules
- Enter a buy when a green arrow appears from the Total Power Signal indicator.
- Confirm the entry if the Force MACD histogram turns green.
- Place a stop loss a few pips below the recent swing low.
- Take profit when a magenta arrow appears or the Force MACD histogram turns red.
- Optionally, target the next minor resistance level.
Sell Entry Rules
- Enter a sell when a magenta arrow appears from the Total Power Signal indicator.
- Confirm the entry if the Force MACD histogram turns red.
- Place a stop loss a few pips above the recent swing high.
- Take profit when a green arrow appears or the Force MACD histogram turns green.
- Optionally, target the next minor support level.
Case Study 1: Bullish Momentum Alignment
On a 1-minute EUR/USD chart, a green arrow appeared from the Total Power Signal indicator, signaling a potential upward move.
At the same time, the Force MACD histogram shifted to green, confirming strong buying pressure.
A buy trade was opened with a stop loss placed just below the recent swing low.
Price moved quickly in the upward direction as momentum increased.
The trade was closed when the Force MACD histogram turned red, capturing a fast scalp profit within a short period.
Case Study 2: Bearish Scalping Opportunity
On a 5-minute GBP/USD chart, a magenta arrow appeared from the Total Power Signal indicator, indicating a bearish setup.
Shortly after, the Force MACD histogram turned red, confirming that selling pressure was building.
A sell trade was placed with a stop loss just above the recent swing high.
Price dropped steadily as bearish momentum strengthened.
The position was closed when a green histogram appeared, signaling weakening downside pressure.
This trade captured a clean downward move and demonstrated how combining directional signals with momentum can improve trade timing and exits.
Download Now
Total_Power_Indicator_Signal.mq5 Indicator (MT5)
FAQ
What type of market conditions suit the Total Power Signal Indicator best?
It performs best in active markets where price moves with momentum. Strong session volatility improves the quality of reversal arrows.
Can the indicator be combined with other tools?
Yes. Many traders combine it with support and resistance levels or moving averages to filter weaker signals.
How can I reduce false signals on lower timeframes?
You can increase the period setting to smooth signal generation and focus only on arrows that align with the higher timeframe trend.
Is it suitable for swing trading?
Yes. By applying it to H1 or H4 charts and adjusting the period, it can help identify broader reversal points.
Summary
The Total Power Signal Indicator is built for traders who prefer direct and actionable signals.
Its colored arrows highlight potential reversal points without requiring complex interpretation.
This makes execution faster, especially for scalpers and intraday traders operating during the London and New York sessions.
With adjustable sensitivity and customizable visuals, the indicator adapts to different trading styles and timeframes.
When combined with confirmation from key price levels, it can become a practical tool for spotting early trend shifts and managing trades with confidence.





