About the Trading The Trend Indicator
The Trading The Trend indicator for MT5 is a technical analysis tool based on the methodologies introduced by Andrew Abraham.
It provides a visual representation of market momentum by altering the color of price candlesticks and plotting confirming dotted lines above or below the price action.
Deep sky blue elements signify a bullish trend, while sandy brown indicates bearish momentum.
By streamlining trend detection through these color-coded signals and integrated alerts, the tool helps traders identify potential entry and exit points across various timeframes and currency pairs.
Free Download
Key Features
- Changes candlestick colors to indicate bullish (deep sky blue) or bearish (sandy brown) trends.
- Displays dotted lines below or above candlesticks to confirm trend direction.
- Alerts traders to potential entries and exits based on color shifts.
- Provides both visual and practical signals to simplify trend-following decisions.
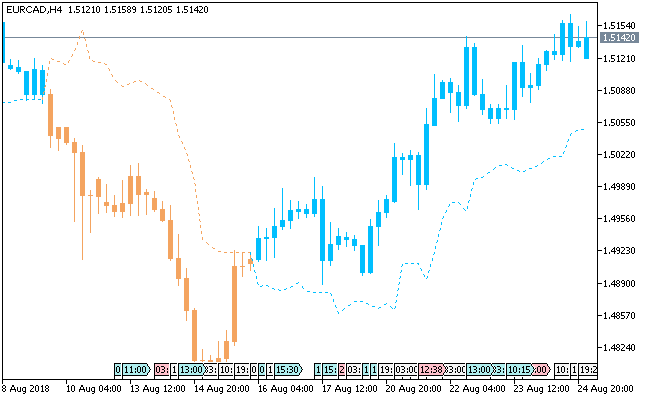
Indicator Chart
The Trading The Trend indicator appears on the main price chart window.
It shows bullish signals with deep sky blue candlesticks and a confirming dotted line below.
Bearish signals appear as sandy brown candlesticks with a dotted line above.
Traders can track trend changes and act promptly using these visual signals and the alert system.

Guide to Trade with Trading The Trend Indicator
Buy Rules
- Enter a long trade when candlesticks turn deep sky blue.
- Confirm the deep sky blue dotted line appears below the candlesticks.
- Check that the overall market trend aligns with the bullish signal.
- Use alerts to catch early continuation signals for timely entries.
Sell Rules
- Enter a short trade when candlesticks turn sandy brown.
- Confirm the sandy brown dotted line appears above the candlesticks.
- Verify higher timeframe trend supports the bearish move.
- Monitor alerts to act quickly on emerging downtrends.
Stop Loss
- Place the stop loss below the deep sky blue dotted line for buy trades.
- Place the stop loss above the sandy brown dotted line for sell trades.
Take Profit
- Close all buy orders if a sandy brown candlestick appears while a bullish trend is ongoing.
- Close all sell orders if a deep sky blue candlestick appears while a bearish trend is ongoing.
- Follow alerts to manage positions and lock in profits as trends reverse.
Download Now
FAQ
How do the candlestick colors signal trades?
The candlestick colors indicate trend direction.
Deep sky blue shows bullish momentum, prompting long entries, while sandy brown indicates bearish momentum, signaling short trades.
What role do the dotted lines play?
Dotted lines confirm trend strength.
A deep sky blue line below candlesticks reinforces a buy signal, and a sandy brown line above confirms a sell signal, reducing false entries.
Do alerts work on all timeframes?
Yes, alerts are available on any timeframe. This allows traders to act promptly on trend changes, whether trading short-term moves or longer-term trends.
Summary
The Trading The Trend indicator simplifies trend-following with clear color-coded candlesticks and confirming dotted lines.
Alerts help traders act promptly on trend changes. Its flexibility makes it suitable for scalping, day trading, and swing trading.
With visual clarity and easy-to-follow rules, traders can enter and exit trades efficiently while managing risk with trailing stop loss strategies.
This indicator is a practical tool for any trending market scenario.


