
About the Trend Analysis Forex Indicator
The Trend Analysis Forex Indicator for MT4 is a multi-timeframe tool designed to highlight the direction of the major trend.
It provides clear buy and sell signals based on the upper three timeframes, helping traders align trades with strong market momentum.
The indicator displays in a sub-window beneath the main chart, showing arrows and UP/DOWN Power percentages.
UP Power indicates bullish strength, while DOWN Power shows bearish strength, giving a quick snapshot of overall market bias.
This indicator is suitable for intraday and swing traders seeking reliable trend-following signals across multiple timeframes.
Free Download
Download the “KG TREND ANALYSIS.mq4” indicator for MT4
Key Features
- Multi-timeframe trend analysis using the upper three MT4 timeframes
- Buy and sell arrows indicate strong market momentum
- UP Power and DOWN Power show trend strength in percentages
- Sub-window display under the main MT4 chart
- Helps traders follow the major trend for improved entries and exits
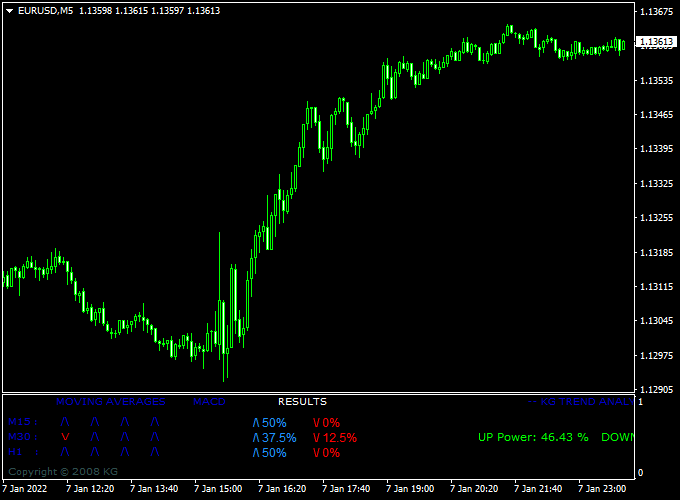
Indicator Chart
The chart displays the Trend Analysis Forex Indicator in a sub-window.
Blue arrows indicate strong bullish signals, while red arrows show strong bearish signals.
UP Power and DOWN Power percentages provide additional context on trend strength, helping traders decide the best entry or exit points.
Guide to Trade with Trend Analysis Forex Indicator
Buy Rules
- Enter a buy trade when all arrows are blue, signaling strong bullish momentum.
- Confirm the trend direction with UP Power above 60% for stronger conviction.
Sell Rules
- Enter a sell trade when all arrows are red, signaling strong bearish momentum.
- Confirm the trend with DOWN Power above 60% for added reliability.
Stop Loss
- For buy trades, place the stop loss just below the nearest swing low or support zone.
- For sell trades, place the stop loss just above the nearest swing high or resistance zone.
Take Profit
- Use nearby support/resistance levels or pivot points for initial take profit.
- Consider multiple take profit targets to secure partial gains along the trend.
Practical Tips
- Focus on major currency pairs where trend signals are most reliable.
- Use UP/DOWN Power percentages as an extra filter to avoid weak signals.
- Monitor market news that could affect volatility and trend strength.
Trend Analysis Indicator + Awesome Oscillator Forex Scalping Strategy
This scalping strategy combines the Trend Analysis Forex Indicator with the Awesome MetaTrader 4 Forex Indicator for MetaTrader 4.
The Trend Analysis Indicator identifies strong market trends using colored arrows—blue for bullish trends and red for bearish trends.
The Awesome Indicator functions as an oscillator, providing buy signals when above zero and sell signals when below zero.
This strategy is designed for short-term scalping on M1 and M5 charts and works best on high-liquidity pairs such as EUR/USD, GBP/USD, and USD/JPY.
Buy Entry Rules
- Ensure that all arrows on the Trend Analysis Indicator are blue, indicating a strong uptrend.
- Confirm that the Awesome Indicator oscillator is above zero, signaling bullish momentum.
- Enter a buy trade at the current market price.
- Place a tight stop loss below the most recent swing low or minor support level.
- Take profit at 5–15 pips for M1 charts or 10–20 pips for M5 charts, depending on volatility.
Sell Entry Rules
- Ensure that all arrows on the Trend Analysis Indicator are red, indicating a strong downtrend.
- Confirm that the Awesome Indicator oscillator is below zero, signaling bearish momentum.
- Enter a sell trade at the current market price.
- Place a tight stop loss above the most recent swing high or minor resistance level.
- Take profit at 5–15 pips for M1 charts or 10–20 pips for M5 charts, depending on volatility.
Advantages
- Combines trend confirmation with oscillator signals for precise entry points.
- Works well for fast scalping on short timeframes.
- Clear visual signals make it beginner-friendly.
- Applicable to multiple major currency pairs.
Drawbacks
- Signals can be delayed during rapid market spikes, causing late entries.
- Requires constant monitoring due to the fast pace of scalping trades.
- Stop losses can be hit by sudden news-driven volatility.
Case Study 1 – EUR/USD M1
During the New York session, all arrows on the Trend Analysis Indicator turned blue, confirming a strong uptrend.
The Awesome Indicator was above zero, signaling a buy.
A buy trade was entered at 1.1055, with a stop loss at 1.1050 and a take profit at 1.1065.
The price moved quickly in favor of the trade, hitting the target within 10 minutes for a 10-pip gain.
Case Study 2 – GBP/JPY M5
On the GBP/JPY M5 chart, all arrows turned red, indicating a strong downtrend.
The Awesome Indicator oscillator was below zero, confirming bearish momentum.
A sell trade was entered at 149.25 with a stop loss at 149.35 and a take profit at 149.10.
The trade moved as expected, reaching the take profit target for a 15-pip gain.
Strategy Tips
- Always confirm trend direction with the Trend Analysis Indicator before entering trades.
- Use short-term timeframes (M1 and M5) for scalping and adjust take profit according to market volatility.
- Avoid trading during major news events to prevent sudden price spikes.
- Consider using partial exits to lock in profits quickly in fast-moving markets.
- Focus on high-liquidity currency pairs for tighter spreads and better execution.
- Use previous swing highs and lows as additional confirmation for stop loss placement.
Download Now
Download the “KG TREND ANALYSIS.mq4” indicator for Metatrader 4
FAQ
How does the indicator determine trend strength?
Trend strength is calculated using the upper three timeframes. UP Power and DOWN Power percentages indicate the relative strength of bullish and bearish momentum.
Are the signals reliable on all currency pairs?
The indicator works on any pair, but trending major pairs tend to produce the clearest and most actionable signals.
Does it repaint or change signals?
No, once the arrows and power percentages appear, they remain fixed, giving traders a reliable reference for planning trades.
Summary
The Trend Analysis Forex Indicator for MT4 gives traders a clear view of market momentum across multiple timeframes.
It highlights strong buy and sell signals with UP and DOWN Power percentages, helping identify trades aligned with the dominant trend.
By combining the indicator with proper stop loss and take profit levels, traders can better manage risk, confirm entries, and capture higher-probability moves.


