
About the TRIX Indicator with Support & Resistance
The TRIX Indicator with Support & Resistance is a momentum-based trading tool designed for MetaTrader 5.
It combines the TRIX oscillator with automatic support and resistance levels derived from overbought and oversold market conditions.
TRIX stands for Triple Exponential Average, a momentum indicator that filters short-term noise and focuses on the underlying trend direction.
The indicator appears in the main price area and beneath it.
The main price area displays horizontal support and resistance levels calculated from extreme TRIX readings.
Beneath the price area, the TRIX oscillator highlights market momentum and identifies possible reversal zones through color changes.
A blue TRIX line signals that the market has reached an overbought level, while an orange TRIX line indicates oversold conditions.
These signals help traders anticipate potential turning points and plan trades near important price levels.
The indicator often produces stronger signals when used together with a trend indicator such as moving averages or Bollinger Bands.
Combining momentum analysis with trend direction allows traders to focus on higher probability setups.
Free Download
Key Features
- Uses the TRIX oscillator to detect overbought and oversold market levels.
- Automatically plots support and resistance levels in the main price area.
- Color-coded TRIX signals help traders identify potential reversal conditions.
- Includes customizable parameters such as period, price type, and line style.
- Allows adjustments to line width and colors for personalized display.
- Works effectively when combined with trend indicators.
Indicator Chart
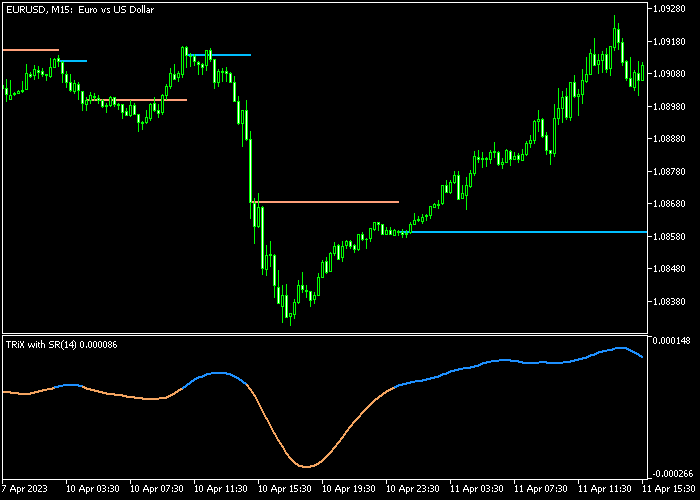
The TRIX Indicator with Support & Resistance highlights momentum extremes together with important price levels.
The main price area displays horizontal support and resistance zones generated from TRIX signals.
Beneath it, the TRIX oscillator changes color between blue and orange to show overbought and oversold conditions, helping traders recognize possible buy and sell opportunities as momentum shifts.
Guide to Trade with the TRIX Indicator with Support & Resistance
Buy Rules
- Wait for the orange TRIX line to appear in the indicator area, indicating an oversold market condition.
- Confirm that the overall market trend is moving upward before entering a trade.
- Open a buy position when price reacts near the support level shown in the main price area.
- Manage the trade while the TRIX momentum begins to move upward from the oversold zone.
Sell Rules
- Wait for the blue TRIX line to appear in the indicator area, signaling an overbought market condition.
- Confirm that the broader market trend is moving downward.
- Open a sell position when price approaches the resistance level shown in the main price area.
- Monitor the trade as the TRIX momentum begins to decline from the overbought zone.
Stop Loss
- Place the stop loss below the previous swing low for buy trades.
- For sell trades, place the stop loss above the previous swing high.
- Avoid placing stop losses directly on the support or resistance lines.
Take Profit
- Close buy trades when the blue overbought TRIX line appears in the indicator area.
- Close sell trades when the orange oversold TRIX line appears in the indicator area.
TRIX Reversal Indicator Day Trading Strategy for MT5
This strategy combines the TRIX Indicator with Support Resistance with the Bollinger Bands Indicator to create a balanced system that captures reversals within trending conditions.
The TRIX Indicator is a momentum oscillator designed to filter out market noise and highlight meaningful price movements.
In this setup, the orange TRIX line suggests an oversold market and a potential buy opportunity, while the blue TRIX line signals an overbought market and a potential sell opportunity.
The Bollinger Bands Indicator provides a visual representation of volatility and trend direction.
When the bands are rising, it reflects bullish conditions with expanding price movement.
When the bands are falling, it indicates bearish pressure and downward direction.
It blends momentum-based reversals with volatility-driven trend direction, helping traders find cleaner entries during intraday movements on M15 and H1 timeframes.
Buy Entry Rules
- Wait for the Bollinger Bands to slope upward, confirming a bullish trend.
- Wait for the TRIX line to turn orange, indicating an oversold condition.
- Enter a buy trade at the close of the confirmation candle.
- Place a stop loss below the most recent swing low or near the lower band.
- Take profit when the TRIX turns blue or when price approaches the upper band.
Sell Entry Rules
- Wait for the Bollinger Bands to slope downward, confirming a bearish trend.
- Wait for the TRIX line to turn blue, indicating an overbought condition.
- Enter a sell trade at the close of the confirmation candle.
- Set the stop loss above the most recent swing high or near the upper band.
- Take profit when the TRIX turns orange or when price approaches the lower band.
Case Study 1: EURAUD M15 Buy Setup
On EURAUD M15, the Bollinger Bands began to slope upward after a consolidation phase, indicating that bullish pressure was building.
During a short pullback, the TRIX line turned orange, signaling an oversold condition within the uptrend.
A buy trade was entered at the close of the confirmation candle as price started to move higher again.
The stop loss was placed below the recent swing low and slightly under the lower Bollinger Band to account for volatility.
The trade was closed when the TRIX line shifted to blue, signaling overbought conditions and slowing momentum.
Case Study 2: NZDJPY H1 Sell Setup
On NZDJPY H1, the Bollinger Bands were clearly sloping downward, confirming bearish market conditions.
Price retraced toward the middle band, and the TRIX line turned blue, indicating an overbought condition within the downtrend.
A sell trade was entered at the close of the confirmation candle as bearish pressure resumed.
The stop loss was placed above the recent swing high and slightly above the upper Bollinger Band.
The trade was closed when the TRIX line turned orange, indicating that the market was becoming oversold and momentum was weakening.
Download Now
FAQ
What does the TRIX indicator measure?
The TRIX indicator measures momentum using a triple exponential moving average.
This smoothing process removes short-term price fluctuations and highlights the underlying direction of the market.
How are the support and resistance levels calculated?
The indicator generates support and resistance levels from TRIX overbought and oversold signals.
When momentum reaches extreme levels, the indicator projects horizontal zones that often act as reaction areas in the market.
Which indicators work best with the TRIX indicator?
Trend-following indicators such as moving averages or Bollinger Bands often complement TRIX signals.
Combining a trend filter with momentum signals can help traders focus on trades that align with the broader market direction.
Summary
The TRIX Indicator with Support & Resistance combines momentum analysis with automatic price level detection.
By integrating the triple exponential average oscillator with horizontal support and resistance zones, the indicator helps traders identify possible reversal areas and plan trades with more confidence.
The color-coded TRIX signals highlight overbought and oversold market conditions, while the horizontal levels provide logical areas for entries, stop placement, and profit targets.
This combination creates a practical framework for analyzing price movements and managing trades.
When used together with a trend indicator, the TRIX Indicator with Support & Resistance can help traders align momentum signals with the broader market direction and improve the overall quality of trade setups.


