
About the Zone Trade Histogram Scalper Indicator
The Zone Trade Histogram Scalper indicator for MT5 identifies short-term buy and sell opportunities, ideal for scalpers trading low timeframes.
The indicator uses colored histogram bars in a separate chart window to show trend direction and potential entry points.
Blue bars signal bullish scalper trends, orange bars signal bearish trends, and gray bars indicate sideways market movement.
This visual approach helps traders quickly react to fast-moving price action.
The indicator is particularly effective on lower spread Forex pairs for M1 and M5 charts.
Traders can customize the bar colors and style to match personal preferences.
Typical profit targets range from 5 to 20 pips, making it suitable for scalping strategies.
By tracking the first colored histogram bar in a new trend, traders can time entries for optimal results.
Free Download
Zone trade histogram.mq5 Indicator (MT5)
Key Features
- The colored histogram shows trend direction: blue for buy, orange for sell, and gray for sideways.
- Quickly identifies scalping opportunities in any currency pair.
- Customizable bar colors and style for a personalized setup.
- Best used on M1 and M5 charts for fast trades.
- Helps scalpers capture small profit targets efficiently.
Indicator Chart
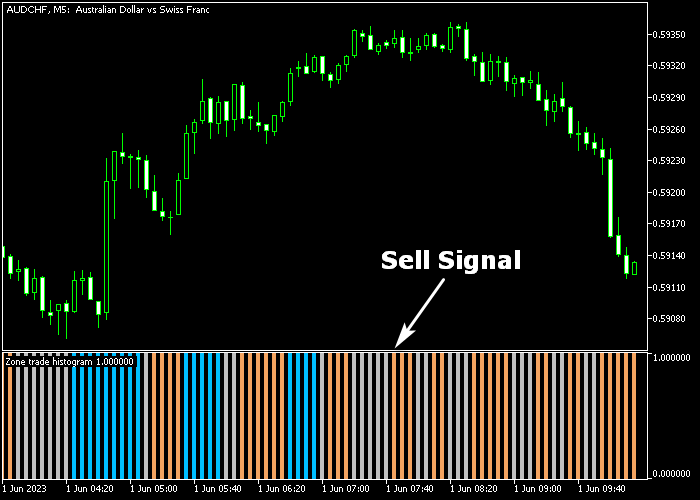
The Zone Trade Histogram Scalper appears beneath the main price chart as colored bars.
Blue bars above indicate bullish momentum, orange bars below indicate bearish momentum, and gray bars indicate sideways movement.
The chart shows trend shifts clearly, allowing scalpers to identify immediate buy or sell opportunities for quick trades.
Guide to Trade with Zone Trade Histogram Scalper Indicator
Buy Rules
- Wait for the first blue histogram bar to appear.
- Confirm short-term bullish momentum is developing.
- Open a buy trade when the trend starts.
- Monitor subsequent bars for continuation or reversal.
Sell Rules
- Wait for the first orange histogram bar to appear.
- Confirm short-term bearish momentum is developing.
- Open a sell trade when the trend starts.
- Monitor subsequent bars for continuation or reversal.
Stop Loss
- For buy trades, place a stop loss below immediate support.
- For sell trades, place a stop loss above immediate resistance.
Take Profit
- Close trades for 5-20 pips depending on the timeframe and instrument.
- Partial exits can lock in small gains during strong trends.
- Follow bar color changes to avoid exiting too early.
Zone Trade Histogram Scalper MT5 Strategy with Trend Confirmation
This strategy combines the Zone Trade Histogram Scalper Indicator with the Trend Manager Indicator to build a fast scalping system for lower timeframes such as M1 and M5.
The Zone Trade Histogram Scalper provides direct entry signals through color changes in the histogram.
A first blue bar signals a buy setup, while an orange bar signals a sell setup.
The Trend Manager indicator confirms the broader intraday direction.
Sea-green trend bars indicate bullish market conditions, while magenta bars indicate bearish structure.
This helps filter trades so entries are only taken in the direction of the dominant trend.
This strategy is designed for active scalpers who prefer quick entries during high volatility periods, especially during the London and New York sessions.
Buy Entry Rules
- Confirm that Trend Manager shows sea-green bars, indicating a bullish trend.
- Wait for the first blue histogram bar from the Zone Trade Scalper indicator.
- Enter a buy trade at the close of the signal candle.
- Place the stop loss below the most recent swing low or below a minor consolidation zone.
- Trail the stop loss under the Trend Manager structure or recent swing lows as price moves upward.
- Exit the trade when the histogram turns orange or when Trend Manager shifts to magenta.
Sell Entry Rules
- Confirm that Trend Manager shows magenta bars, indicating a bearish trend.
- Wait for the first orange histogram bar from the Zone Trade Scalper indicator.
- Enter a sell trade at the close of the signal candle.
- Place the stop loss above the most recent swing high or above a minor resistance zone.
- Trail the stop loss above the Trend Manager structure or recent swing highs as price moves downward.
- Exit the trade when the histogram turns blue or when Trend Manager shifts to sea-green.
Case Study 1: Buy Trade Example (EUR/USD M5)
The Trend Manager displayed sea-green bars, confirming a bullish intraday structure.
After a short consolidation phase, the Zone Trade Histogram printed its first blue bar, signaling a potential long setup.
A buy trade was opened at the candle close, with the stop loss placed below the recent swing low.
As price moved upward, the stop was trailed beneath new structure levels and the Trend Manager support zone.
The trade was closed when the histogram turned orange, showing a loss of bullish momentum, while the Trend Manager began flattening, signaling the end of the move.
Case Study 2: Sell Trade Example (GBP/JPY M1)
The Trend Manager showed magenta bars, confirming bearish pressure during the session.
Shortly after a small retracement, the Zone Trade Histogram printed an orange bar, confirming a sell signal.
A sell trade was opened at the candle close with the stop loss placed above the recent swing high.
Price moved downward in short bursts, and the stop was trailed above minor structure levels.
The trade was closed when a blue histogram bar appeared, indicating a shift in momentum, while the Trend Manager began transitioning away from magenta, showing that bearish conditions were weakening.
Download Now
Zone trade histogram.mq5 Indicator (MT5)
FAQ
What do the different histogram colors mean?
Blue bars indicate bullish scalper trends, orange bars indicate bearish trends, and gray bars indicate sideways market conditions.
Which timeframes are best for this indicator?
M1 and M5 charts are ideal for scalping with this indicator. Higher timeframes can also be used but are less suitable for fast trades.
How do I adjust the indicator settings?
You can change the histogram colors and bar style to suit your trading preferences and improve visibility.
Summary
The Zone Trade Histogram Scalper indicator provides a fast and visual way to capture short-term buy and sell opportunities.
Its colored bars help scalpers identify immediate trend changes for quick trades.
By following the first trend bar and monitoring subsequent bars, traders can achieve consistent small profits and improve scalping efficiency.


