About the Simple Moving Average (SMA) Indicator
The Simple Moving Average (SMA) Indicator for MetaTrader 5 is a classic trend tool that applies equal weight to all price data in its lookback period.
It is widely used to define trend direction and build crossover systems in forex trading.
Popular SMA periods include 200, 50, 20, 8, and 5, which cover long term, swing, and intraday styles.
A price move above the simple moving average is considered bullish, while a price move below the simple moving average is considered bearish.
The SMA reacts more slowly than faster averages such as the EMA, but this slower response helps reduce false signals in choppy conditions.
The main inputs are the SMA period and the price type, so you can adjust how smooth or responsive the line is.
Because it is simple and versatile, the SMA suits scalping, day trading, and swing trading with the same core logic.
Free Download
Key Features
- Equal weight on past and recent prices for a balanced trend line.
- Clear bullish and bearish bias based on price trading above or below the SMA.
- Commonly used periods such as 200, 50, 20, 8, and 5 for multiple trading styles.
- Well suited for crossover systems and trend following methods.
- Slower than EMA but tends to produce fewer false signals in sideways markets.
- Simple settings with adjustable SMA period and price source.
Indicator Chart
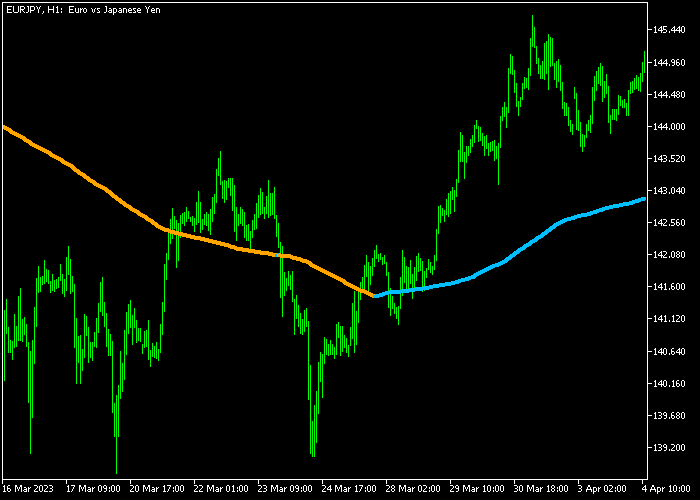
On the chart, the Simple Moving Average Indicator appears as a smooth line drawn over price.
Many traders use blue for the bullish version and orange for the bearish version to keep trend direction easy to see.
When price is above a rising SMA, the market is treated as being in an uptrend, and when price is below a falling SMA, the bias is down.

Guide to Trade with the Simple Moving Average (SMA) Indicator
Buy Rules
- Wait for the blue SMA line to be visible with price moving above it.
- Confirm that recent candles are closing above the SMA and the line is sloping upward.
- Open a buy trade after a strong bullish candle closes above the SMA with space to the next resistance.
- Hold the position while price stays above the SMA and the line continues to point higher.
Sell Rules
- Wait for the orange SMA line to be visible with price trading below it.
- Confirm that recent candles are closing below the SMA and the line is sloping downward.
- Open a sell trade after a clear bearish candle closes below the SMA with room to nearby support.
- Keep the position open while price remains under the SMA and the line continues to slope lower.
Stop Loss
- For buy trades, set the stop loss about 5 pips below the previous swing low.
- For sell trades, place the stop loss about 5 pips above the previous swing high.
- Avoid placing stops exactly on the SMA line, as minor pullbacks may spike into the average.
- As price moves in your favor, consider trailing the stop beyond new swing lows or highs.
Take Profit
- Use fixed take profit targets based on nearby resistance for buys and support for sells.
- For buys, you can close at your planned target or wait for a new bearish signal to appear on the SMA.
- For sells, you can exit at your chosen level or wait for a fresh bullish signal from the SMA.
- Partial exits at key zones with a remaining position left to ride the trend can help capture extended moves.
SMA Indicator with Brain Trend Signal Scalping Strategy for MT5
This scalping strategy combines the Simple Moving Average (SMA) indicator with the Brain Trend Signal Alert indicator to capture short-term momentum moves in fast markets.
The SMA helps define the main intraday direction. A blue SMA line shows bullish conditions, while an orange SMA line indicates bearish pressure.
The Brain Trend Signal provides precise timing through arrows, where blue arrows signal buy opportunities and red arrows signal sell opportunities.
This combination works well for scalping because it filters trades in the direction of the trend while using signal-based entries for timing.
It performs best on M1 and M5 charts during active trading hours, especially on volatile pairs such as EURUSD, GBPUSD, EURJPY, and XAUUSD.
Buy Entry Rules
- Wait for the SMA line to turn blue indicating an uptrend.
- Look for a blue Brain Trend arrow appearing on the chart.
- Enter a buy trade at the opening of the next candle after the arrow appears.
- Set the stop loss below the most recent swing low or below the SMA line.
- Close the trade when a red Brain Trend arrow appears or when the SMA turns orange.
Sell Entry Rules
- Wait for the SMA line to turn orange indicating a downtrend.
- Look for a red Brain Trend arrow appearing on the chart.
- Enter a sell trade at the opening of the next candle after the arrow appears.
- Place a stop loss above the most recent swing high or above the SMA line.
- Close the trade when a blue Brain Trend arrow appears or when the SMA turns blue.
Case Study 1
On EURUSD M5 during the London session, the SMA turned blue after a short consolidation phase, indicating a bullish trend.
Shortly after, a blue Brain Trend arrow appeared below price, confirming upward momentum.
A buy trade was entered at the next candle open. Price moved upward in a steady intraday push with limited pullbacks.
Around 2 hours later, a red Brain Trend arrow appeared, showing weakening momentum, and the trade was closed for 29 pip gain.
Case Study 2
On GBPJPY M1 during the US session, the SMA turned orange following a sharp rejection from resistance, indicating bearish conditions.
Shortly after, a red Brain Trend arrow formed above price, confirming selling pressure.
A sell trade was entered at the next candle open. Price dropped quickly with strong momentum.
About 25 minutes later, a blue Brain Trend arrow appeared and price started to stabilize, so the trade was closed, unfortunately for a 10 pip loss.
Download Now
FAQ
Which SMA period is most popular in forex trading?
Common choices are the 200 and 50 period SMAs for higher timeframe trend direction and the 20, 8, or 5 period SMAs for shorter term timing.
Longer periods give smoother signals, while shorter periods react faster.
You can combine a slow SMA for trend and a faster SMA for entries if you prefer crossover signals.
How does the SMA compare to the EMA in MT5?
The SMA gives equal weight to all prices in its period and therefore moves more slowly.
The EMA gives more weight to recent prices, so it responds faster to new moves.
Many traders use the SMA when they want stability and fewer whipsaws and keep EMA for aggressive, short term strategies.
Can I use the SMA on lower timeframes for scalping?
Yes, the SMA can be used on any timeframe, including very short charts.
On lower timeframes, pairing a short period SMA with basic price action can help confirm direction.
Summary
The Simple Moving Average Indicator is a reliable, easy to understand trend tool that treats all price data equally.
It supports a wide range of strategies from basic trend following to crossover systems on any timeframe.
Price trading above or below the SMA offers a straightforward bullish or bearish bias.
Used together with support, resistance, and clean price action, it can become a core part of many trading plans.


