
About the Colored RSI Indicator
The Colored RSI Indicator for MetaTrader 5 is a modified RSI oscillator that turns momentum into easy to read color zones.
It uses three distinct colors to separate buy, sell, and neutral conditions on a dedicated subchart.
This helps you quickly see when the market is shifting from accumulation to distribution without focusing on changing RSI numbers.
The tool is especially useful if you prefer visual confirmation instead of traditional overbought and oversold lines.
By combining trend direction with color changes, it provides a practical framework for timing entries, exits, and avoiding weak setups.
Key Features
- Three color zones that highlight bullish, bearish, and neutral RSI conditions for quick visual decision making.
- Inputs for RSI period, levels, and neutral zone so you can tune the indicator to your trading style and timeframe.
- Customizable colors and line style to match the RSI window with the rest of your MT5 chart layout.
- Helps filter out noise by focusing on momentum zones where the probability of a reversal or continuation is higher.
Free Download
Indicator Chart
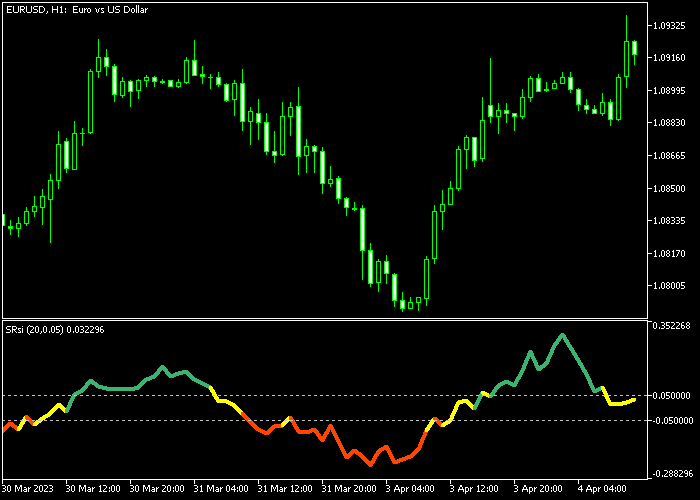
On the chart, the Colored RSI Indicator for MT5 plots a single RSI line that changes color between green, red, and yellow as momentum shifts.
Green segments mark a buy zone where bullish pressure dominates, while red segments highlight a sell zone with downside momentum.
Yellow segments indicate a neutral zone where price is consolidating and fresh trades should be taken with care.
Guide to Trade with the Colored RSI Indicator
Buy Rules
- Wait for the Colored RSI line to turn green from below or from inside the neutral zone, showing fresh bullish momentum.
- Confirm that price is trading above a recent support level or forming higher lows on your main chart.
- Enter a buy trade as the green zone holds for at least one or two candles instead of jumping in on the first tick of the change.
- Stay in the position as long as the RSI remains green or neutral and price action respects support.
Sell Rules
- Wait for the Colored RSI line to turn red from above or from the neutral zone, indicating a shift toward bearish momentum.
- Check that price is trading below a recent resistance area or forming lower highs on the main chart.
- Open a sell trade once the red zone persists for one or two candles, avoiding signals that instantly snap back to neutral.
- Hold the short while the RSI stays red or neutral and price continues to respect resistance levels.
Stop Loss
- For buy trades, place the stop loss below the most recent swing low.
- For sell trades, place the stop loss above the most recent swing high.
- Avoid stops that are so tight they sit inside regular noise, since RSI can fluctuate before a move builds strength.
Take Profit
- For buys, look to scale out as the RSI leaves the green zone and starts to move into the neutral or opposite color.
- For sells, secure gains when the RSI exits the red zone and begins to flatten or turn neutral.
- More advanced traders can trail stops behind higher lows in uptrends or lower highs in downtrends while the RSI color still agrees with the trade.
Colored RSI MT5 + Jurik Moving Average Scalping Strategy
This strategy combines the Colored RSI indicator with the Jurik Moving Average indicator to create a fast and responsive scalping method.
The Colored RSI provides clear momentum signals through color changes, making it easier to spot short term shifts in market direction.
The Jurik Moving Average acts as a trend filter.
Price trading above the JMA reflects bullish conditions, while price below it indicates bearish pressure.
This strategy is built for M1 and M5 charts and works best on volatile pairs such as GBPJPY, EURJPY, and XAUUSD where short bursts of momentum occur frequently.
Buy Entry Rules
- Wait for the Colored RSI line to turn green indicating bullish momentum.
- Confirm that the candle closes above the Jurik Moving Average.
- Enter a buy trade at the opening of the next candle.
- Place a stop loss below the Jurik Moving Average or below the recent micro support level.
- Close the trade when the Colored RSI turns red or when price closes below the Jurik Moving Average.
Sell Entry Rules
- Wait for the Colored RSI line to turn red indicating bearish momentum.
- Confirm that the candle closes below the Jurik Moving Average.
- Enter a sell trade at the opening of the next candle.
- Place the stop above the Jurik Moving Average or above the recent micro resistance level.
- Close the trade when the Colored RSI turns green or when price closes above the Jurik Moving Average.
Case Study 1
On the GBPJPY M5 timeframe, the Colored RSI line turned green after a short pullback, signaling renewed bullish momentum.
Shortly after, price moved above the Jurik Moving Average, confirming trend direction.
A buy trade was entered at the next candle open. Price accelerated upward with strong momentum and remained above the JMA line.
The position stayed active as long as both indicators supported the move.
About 25 minutes later, the Colored RSI turned red, signaling weakening momentum, and the trade was closed for 27 pips.
Case Study 2
On the XAUUSD M1 timeframe, the Colored RSI line turned red as volatility increased.
Price simultaneously moved below the Jurik Moving Average, confirming bearish conditions.
A sell trade was entered at the next candle open. Price dropped quickly with strong downward momentum.
The position remained open while price stayed below the JMA and RSI remained red.
Around 10 minutes later, price closed back above the Jurik Moving Average, and the trade was closed for 22 pips as bearish pressure faded.
Download Now
FAQ
How is the Colored RSI Indicator different from the standard RSI in MT5?
The Colored RSI Indicator replaces a single color line with changing colors that show bullish, bearish, and neutral zones.
This makes it easier to read momentum without constantly checking numerical RSI values.
What are good settings for the Colored RSI Indicator?
A common starting point is a 14 period RSI with default overbought and oversold levels.
Short term traders may lower the period to around 9 to capture quicker shifts, while swing traders may increase it to 21 or more for smoother moves.
Summary
The Colored RSI Indicator turns a classic oscillator into a visual tool that highlights buy, sell, and neutral zones through simple color changes.
The adjustable period, levels, and colors make it easy to adapt the indicator to different markets and strategies while keeping the display simple.
Future tweaks such as alerts or multi timeframe views could add more flexibility.
For best results, trade it with support and resistance and focus on the most liquid sessions of the day.


