About the RSI Indicator with Support & Resistance
The RSI Indicator with Support & Resistance is a momentum trading tool developed for MetaTrader 5.
It combines the classic Relative Strength Index oscillator with automatically generated support and resistance levels derived from overbought and oversold RSI conditions.
This combination allows traders to identify potential reversal areas while monitoring market momentum at the same time.
The main price area displays horizontal support and resistance levels calculated from RSI extremes.
Beneath the price area, the RSI oscillator tracks momentum and highlights potential turning points through color changes.
A blue RSI line signals that the market has reached an overbought level. An orange RSI line indicates that the market is oversold.
These signals can help traders anticipate possible price reversals near important levels.
Free Download
Key Features
- Uses the RSI oscillator to identify overbought and oversold market conditions.
- Automatically plots support and resistance levels in the main price area.
- Combines momentum analysis with key price levels for trade planning.
- Includes customizable RSI period settings with a default value of 14.
- Allows adjustment of level settings such as upper and lower RSI thresholds.
- Provides options for color, line style, and visual appearance.
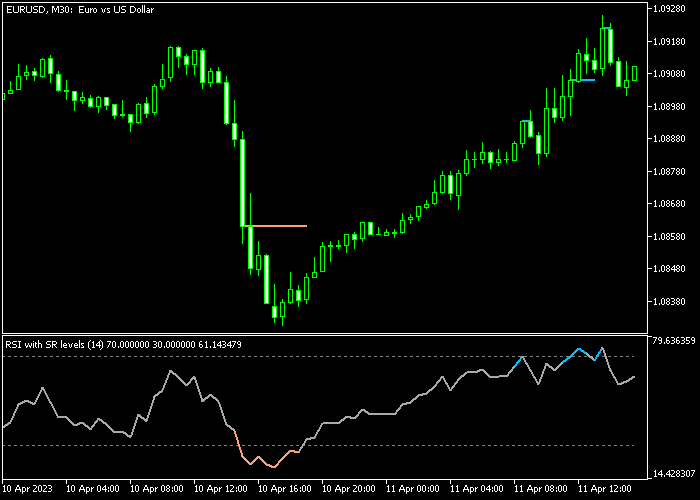
Indicator Chart
The RSI Indicator with Support & Resistance highlights momentum changes together with key price levels.
The main price area shows horizontal support and resistance zones generated from RSI overbought and oversold signals.
Beneath it, the RSI oscillator shifts between blue and orange colors to indicate momentum extremes, helping traders identify possible buy and sell opportunities.

Guide to Trade with RSI Indicator with Support & Resistance
Buy Rules
- Wait for the orange RSI line to appear in the indicator area, signaling an oversold market condition.
- Confirm that the overall market trend is moving upward before considering a trade.
- Open a buy position when price reacts near the support level shown in the main price area.
- Manage the position while RSI momentum begins to rise from the oversold zone.
Sell Rules
- Wait for the blue RSI line to appear in the indicator area, indicating an overbought market condition.
- Confirm that the broader trend direction is downward.
- Open a sell trade when price approaches the resistance level displayed in the main price area.
- Monitor the position as RSI momentum starts to move lower from the overbought zone.
Stop Loss
- Place the stop loss slightly below the most recent support zone for buy trades.
- For sell trades, place the stop loss slightly above the nearest resistance zone.
Take Profit
- Close buy trades when the blue overbought RSI line appears in the indicator area.
- Close sell trades when the orange oversold RSI line appears in the indicator area.
- Traders may also secure partial profits when RSI momentum begins to reverse.
MT5 RSI Indicator with Support Resistance Scalping Strategy
This scalping strategy combines the RSI Indicator with Support Resistance for MT5 with the Super Trend Indicator to create a fast and reliable trading approach for M1 and M5 charts.
The RSI indicator helps identify overbought and oversold conditions using dynamic support and resistance levels.
An orange RSI line signals oversold conditions where price may reverse upward, while a blue RSI line indicates overbought conditions where price may turn lower.
The Super Trend indicator provides clear trend direction by plotting a line that changes color based on market movement.
A green line below price shows a bullish trend, while a red line above price signals a bearish trend.
By combining momentum reversal signals from RSI with the directional bias of Super Trend, this strategy filters out weak setups and focuses on high-probability scalping opportunities during active market sessions.
Buy Entry Rules
- Confirm that the Super Trend line is green, indicating a bullish market direction.
- Wait for the RSI line to turn orange, showing oversold conditions.
- Enter a buy trade when the RSI starts moving upward from the oversold zone.
- Place the stop loss a few pips below the recent swing low or below the Super Trend line.
- Close the trade when the RSI turns blue or when the Super Trend line switches to red.
Sell Entry Rules
- Confirm that the Super Trend line is red, indicating a bearish market direction.
- Wait for the RSI line to turn blue, showing overbought conditions.
- Enter a sell trade when the RSI starts moving downward from the overbought zone.
- Place the stop loss a few pips above the recent swing high or above the Super Trend line.
- Close the trade when the RSI turns orange or when the Super Trend line switches to green.
Case Study 1: EURUSD M1 Buy Trade
On the EURUSD M1 chart, the Super Trend line was green, confirming a bullish trend.
Price pulled back slightly, and the RSI line turned orange, indicating oversold conditions within the uptrend.
A buy trade was opened as the RSI started moving upward from the oversold level.
The stop loss was placed below the recent swing low to control risk.
The trade was closed when the RSI turned blue, signaling overbought conditions and a possible short-term pullback against the trend.
Case Study 2: GBPUSD M5 Sell Trade
On the GBPUSD M5 chart, the Super Trend line turned red, indicating a bearish market.
Shortly after, the RSI line turned blue, showing overbought conditions during a pullback.
A sell trade was entered as the RSI started to move downward from the overbought zone.
The stop loss was placed above the recent swing high to allow normal price movement.
The trade was closed when the Super Trend line switched back to green, confirming that bearish pressure had ended and a reversal was beginning.
Download Now
FAQ
What does the RSI indicator measure?
The RSI indicator measures the speed and strength of recent price movements.
It helps traders determine whether a market is potentially overbought or oversold, which can indicate possible reversal zones.
How are the support and resistance levels generated?
The indicator calculates support and resistance levels using RSI momentum extremes.
When the RSI reaches overbought or oversold conditions, the indicator projects horizontal zones that often become important price reaction levels.
What settings are available in the indicator?
The indicator includes adjustable parameters such as the RSI period, price source, upper and lower levels, colors, and line style.
These settings allow traders to tailor the indicator to different trading styles and timeframes.
Summary
The RSI Indicator with Support & Resistance combines momentum analysis with automatically generated price levels.
By linking RSI overbought and oversold signals with support and resistance zones, the indicator provides traders with practical areas for potential entries and exits.
The color-based RSI signals make it easy to spot momentum extremes, while the horizontal levels highlight important price zones where the market may react.
This combination can help traders improve trade timing and manage positions more effectively.
When used alongside a trend indicator, the tool becomes even more powerful.
It allows traders to focus on RSI signals that align with the broader market direction while using support and resistance levels to refine their trading decisions.


