
About the CCI Indicator with Support & Resistance
The CCI Indicator with Support & Resistance for MT5 combines the Commodity Channel Index oscillator with automatically calculated support and resistance zones.
This tool helps traders identify momentum extremes while also highlighting price levels where the market may react.
The indicator operates in two areas of the platform.
The main price area displays horizontal support and resistance levels generated from CCI signals.
A separate indicator window below the price area shows the CCI oscillator itself, which tracks market momentum and highlights overbought and oversold conditions.
A blue CCI line represents an overbought market environment, while an orange CCI line signals oversold conditions.
Using a trend filter together with CCI signals can improve the quality of trade setups and help traders focus on opportunities that align with the prevailing market direction.
Free Download
Key Features
- Uses the Commodity Channel Index to identify momentum extremes in the market.
- Automatically plots support and resistance levels in the main price area.
- Includes a separate indicator window to display the CCI oscillator.
- Provides customizable settings such as CCI period and applied price.
- Allows adjustments to upper and lower level colors when levels are broken.
- Supports customization of line width and line style.
Indicator Chart
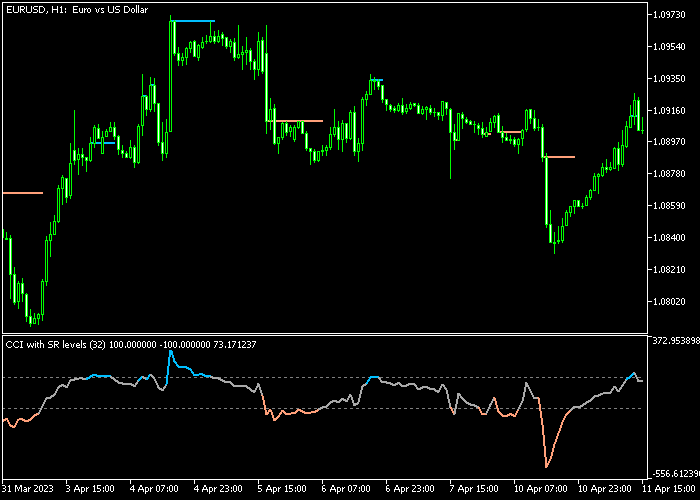
The CCI Indicator with Support & Resistance highlights momentum signals together with important price zones.
The main price area shows horizontal support and resistance levels created from CCI signals.
In the separate indicator window below, the CCI line shifts between blue and orange colors to represent overbought and oversold momentum conditions, helping traders detect potential buy and sell opportunities.
Guide to Trade with the CCI Indicator with Support & Resistance
Buy Rules
- Wait for the orange CCI line to appear in the indicator window, signaling an oversold condition.
- Confirm that the overall market trend is moving upward.
- Open a buy trade when price reacts near the support level displayed in the main price area.
- Monitor the trade as CCI momentum begins to rise from the oversold zone.
Sell Rules
- Wait for the blue CCI line to appear in the indicator window, indicating an overbought condition.
- Confirm that the overall market trend is moving downward.
- Open a sell position when price approaches the resistance level shown in the main price area.
- Observe the trade as CCI momentum starts to decline from the overbought zone.
Stop Loss
- Place the stop loss below short-term support when opening buy trades.
- For sell trades, position the stop loss above short-term resistance.
- Avoid placing stop losses directly on support or resistance levels.
Take Profit
- Close buy trades when the blue overbought CCI line appears in the indicator window.
- Close sell trades when the orange oversold CCI line appears in the indicator window.
- Alternatively, target the next visible support or resistance level.
MT5 CCI Indicator with Support Resistance Strategy
This strategy combines the CCI Indicator with Support Resistance for MT5 with the Strength Index Signal V1.0 Indicator to create a clear and practical approach for trading on M5 and M15 charts.
The CCI indicator is a momentum oscillator that helps identify overbought and oversold conditions, which often lead to short-term reversals or continuation setups.
The Strength Index Signal indicator provides directional confirmation using arrows.
A blue arrow signals a bullish trend phase, while a red arrow confirms bearish market pressure.
By combining both tools, traders can align momentum extremes with trend direction and avoid weak entries.
This strategy is designed for active intraday traders who want clean entries with defined exits.
It works best during London and New York sessions when volatility supports consistent price movement.
Buy Entry Rules
- Confirm that the Strength Index prints a blue arrow, indicating a bullish trend.
- Wait for the CCI line to turn orange, showing oversold conditions.
- Enter a buy trade when the CCI starts moving upward from the oversold zone.
- Place the stop loss below the most recent swing low or just below a nearby support level.
- Close the trade when the CCI turns blue or when a red arrow appears on the Strength Index.
Sell Entry Rules
- Confirm that the Strength Index prints a red arrow, indicating a bearish trend.
- Wait for the CCI line to turn blue, showing overbought conditions.
- Enter a sell trade when the CCI starts moving downward from the overbought zone.
- Place the stop loss above the most recent swing high or just above a nearby resistance level.
- Close the trade when the CCI turns orange or when a blue arrow appears on the Strength Index.
Case Study 1: EURJPY M5 Buy Trade
On the EURJPY M5 chart, a blue arrow appeared on the Strength Index, confirming bullish direction.
Shortly after, price pulled back and the CCI line turned orange, indicating oversold conditions within the uptrend.
A buy trade was opened as the CCI started moving upward from the oversold zone.
The stop loss was placed below a recent support level formed during the pullback.
About 2 hours later, the long trade was closed when the CCI line turned blue, showing that price had reached an overbought condition and momentum was likely to slow or reverse.
Case Study 2: AUDUSD M15 Sell Trade
On the AUDUSD M15 chart, the Strength Index printed a red arrow, confirming bearish market direction.
Price retraced upward and the CCI line turned blue, signaling overbought conditions.
A sell trade was entered as the CCI began to move downward from the overbought level.
The stop loss was placed above a nearby resistance zone to manage risk.
About 4 hours later, the short trade was closed when a blue arrow appeared on the Strength Index, indicating that bearish pressure had ended and a bullish reversal could begin.
Download Now
FAQ
What does the CCI indicator measure?
The Commodity Channel Index measures the deviation of price from its statistical average.
It helps traders identify when the market moves into extreme conditions that may lead to price corrections or reversals.
How are support and resistance levels created by the indicator?
The indicator calculates support and resistance levels based on CCI momentum signals.
When the oscillator reaches extreme levels, horizontal price zones are projected in the main price area to highlight potential reaction points.
What is the default CCI period used by the indicator?
The default CCI period is typically set to 32. Traders can adjust this value depending on the timeframe or trading strategy they prefer.
Why combine the CCI indicator with a trend indicator?
Combining CCI signals with a trend indicator helps traders filter out trades that go against the prevailing market direction.
Summary
The CCI Indicator with Support & Resistance provides traders with a combination of momentum analysis and key price levels.
By connecting CCI signals with horizontal support and resistance zones, the indicator highlights areas where the market may react or reverse.
The color-coded CCI line helps identify overbought and oversold conditions, while the automatically plotted levels offer logical zones for trade entries and exits.
This combination makes the indicator practical for analyzing momentum and planning trades.
When used alongside a trend-following indicator such as moving averages, the CCI Indicator with Support & Resistance can help traders focus on higher probability setups while using momentum signals to improve timing.


