
About the MACD Indicator with Support & Resistance Levels
The MACD Indicator with Support & Resistance Levels for MT5 combines classic MACD buy and sell signals with dynamic support and resistance lines drawn directly on the main price chart.
This technical tool provides both trend direction and potential reversal levels in one tool.
A blue MACD line signals a bullish trend, while an orange MACD line signals a bearish trend.
The indicator automatically calculates support and resistance levels based on the MACD movements, displaying them as blue and orange lines that adjust as the trend evolves.
Inputs such as fast MACD period, slow MACD period, signal period, applied price, and line colors can be customized to match your trading strategy.
This makes it versatile for scalping, day trading, or swing trading on any instrument available in MT5.
Free Download
Key Features
- Provides buy and sell signals with blue and orange MACD lines.
- Draws dynamic support and resistance levels based on MACD on the main chart.
- Customizable fast and slow MACD periods, signal period, and applied price.
- Adjustable line colors for clear visualization.
- Helps traders identify trend direction and potential reversal levels simultaneously.
- Easy-to-read interface with all information in one chart view.
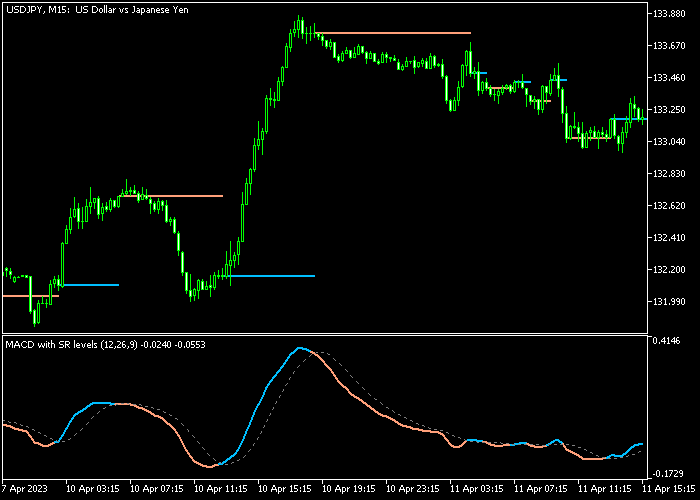
Indicator Chart
The MACD Indicator with Support & Resistance Levels shows colored MACD lines and dynamic S&R lines in the main chart window.
Traders can quickly see bullish or bearish signals while monitoring the nearest support and resistance levels for trade planning.
Guide to Trade with MACD Indicator with Support & Resistance Levels
Buy Rules
- Wait for the MACD line to turn blue, indicating bullish momentum.
- Confirm that the price is respecting nearby support levels.
- Open a buy trade once the bullish signal is confirmed.
Sell Rules
- Wait for the MACD line to turn orange, indicating bearish momentum.
- Confirm that the price is respecting nearby resistance levels.
- Open a sell trade once the bearish signal is confirmed.
Stop Loss
- For buy trades, place the stop loss 3 pips below the most recent MACD-based support line.
- For sell trades, place the stop loss 3 pips above the most recent MACD-based resistance line.
- Consider using nearby swing points for more precise protection.
Take Profit
- Close buy trades at a fixed profit target or when the MACD line turns orange.
- Close sell trades at a fixed profit target or when the MACD line turns blue.
- Optionally take partial profits if the trend remains strong.
MACD Support Resistance Levels MT5 Day Trading Strategy
This day trading strategy combines the MACD Indicator with Support Resistance Levels with the Fibo Pivots Indicator and blends momentum signals with key price levels.
The MACD Indicator with Support Resistance Levels provides clear directional entries using color changes.
When the MACD line turns blue, it signals bullish momentum and a buy opportunity.
When the line switches to orange, it signals bearish momentum and a sell opportunity.
The Fibo Pivots Indicator highlights important intraday levels based on previous price action.
When price is above the central pivot, the market shows bullish bias. When price is below the pivot, the market shows bearish bias.
This combination focuses on trading in the direction of the daily bias while using momentum shifts for precise entries around key levels.
Buy Entry Rules
- Wait for the candle to be above the pivot level, confirming a bullish market bias.
- Wait for the MACD line to turn blue, signaling bullish momentum.
- Enter a buy trade at the close of the confirmation candle.
- Place stop loss below the nearest pivot support level or recent swing low.
- Take profit at the next resistance pivot level or when the MACD line turns orange.
Sell Entry Rules
- Wait for the candle to be below the pivot level, confirming a bearish market bias.
- Wait for the MACD line to turn orange, signaling bearish momentum.
- Enter a sell trade at the close of the confirmation candle.
- Place stop loss above the nearest pivot resistance level or recent swing high.
- Take profit at the next support pivot level or when the MACD line turns blue.
Case Study 1: EURJPY M15 Buy Setup
On EURJPY M15, price opened above the pivot level and remained supported above it, confirming a bullish bias for the session.
During a small pullback toward the pivot, the MACD line briefly weakened but then turned blue again, signaling renewed bullish momentum.
A buy trade was entered at the close of the confirmation candle.
The stop loss was placed just below the pivot level and under the recent swing low to protect against false breaks.
Price moved upward toward the next resistance pivot level in a steady manner.
The buy trade was closed as price approached that resistance zone and momentum began to slow.
Case Study 2: GBPCHF H1 Sell Setup
On GBPCHF H1, price remained below the pivot level after rejecting a resistance area, confirming bearish conditions.
After a brief upward retracement, the MACD line turned orange again, confirming selling pressure.
A sell trade was entered at the close of that candle.
The stop loss was placed above the pivot level and above the recent swing high to allow normal market fluctuations.
Price moved downward toward the next support pivot level with small retracements.
The short trade was closed when the MACD line shifted back to blue, indicating a potential slowdown in bearish momentum.
Download Now
FAQ
Can this indicator be used for scalping?
Yes. Its fast MACD signals and dynamic S&R lines allow for quick entries and exits on lower timeframes.
Can I customize the MACD and line settings?
Yes. You can adjust fast and slow periods, signal period, applied price, and colors for both MACD and S&R lines.
Can I rely on S&R lines for trade management?
Yes. The lines are calculated based on MACD levels and update dynamically, helping with stop placement and trend analysis.
Summary
The MACD Indicator with Support & Resistance Levels provides both trend signals and key levels for trade planning.
Blue and orange MACD lines indicate buy and sell opportunities, while dynamic S&R lines guide stop loss and profit placement.
Customizable inputs and clear chart visuals make it ideal for scalping, day trading, and swing trading, helping traders manage risk and enter trades with confidence.


