About the Trend Rainbow Indicator
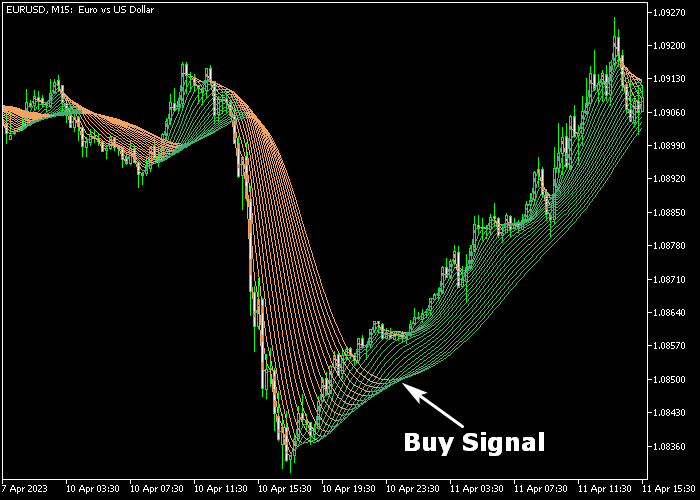
The Trend Rainbow Indicator for MT5 turns multiple moving averages into a visual rainbow, helping traders identify the prevailing market trend quickly.
It displays green and brown colored lines on the chart, forming a “rainbow” that reflects bullish or bearish momentum.
A green rainbow signals an upward trend, while a brown rainbow shows a downward trend.
This makes it simple to spot trend directions at a glance, whether you are scalping, day trading, or swing trading.
The indicator works on any trading instrument available in MT5, including Forex pairs, stocks, indices, and metals.
Traders can customize settings such as step, applied price, up slope color, down slope color, line width, and line style to match their trading style and chart preferences.
Free Download
Trend Rainbow.mq5 Indicator (MT5)
Key Features
- Displays multiple moving averages as a rainbow for trend visualization.
- A green rainbow indicates a bullish trend; a brown rainbow indicates a bearish trend.
- Customizable step and applied price settings.
- Adjustable line colors, widths, and styles for clear visuals.
- Helps identify trend direction at a glance.
- Supports multiple timeframes and trading strategies.
Indicator Chart
The Trend Rainbow Indicator appears on the main price chart as overlapping green and brown moving averages.
The “rainbow” visually highlights bullish and bearish trends, allowing traders to make timely entries and exits based on market momentum.
Guide to Trade with the Trend Rainbow Indicator
Buy Rules
- Wait for the rainbow to turn green, indicating bullish momentum.
- Confirm that price action aligns with the trend direction.
- Open a buy trade when the green rainbow is established.
Sell Rules
- Wait for the rainbow to turn brown, indicating bearish momentum.
- Confirm that price action aligns with the trend direction.
- Open a sell trade when the brown rainbow is established.
Stop Loss
- For buy trades, place the stop loss slightly below the low of the green rainbow.
- For sell trades, place the stop loss slightly above the high of the brown rainbow.
- Consider using swing points to refine stop placement for better risk management.
Take Profit
- Close buy trades at your preferred fixed take profit target, or exit when the rainbow turns brown.
- Close sell trades at your preferred fixed take profit target, or exit when the rainbow turns green.
- Optionally scale out partial profits if the trend remains strong.
Forex Trend Rainbow with Heiken Ashi MT5 Strategy
This forex strategy combines the Forex Trend Rainbow Indicator with the Heiken Ashi Zone Trade Indicator to create a clean trend-following approach with precise entry timing.
The Trend Rainbow Indicator uses multiple moving averages to visualize the overall market direction.
When the rainbow turns green, it reflects a strong bullish trend with price moving upward.
When the rainbow turns brown, it signals a bearish trend with downward pressure dominating.
The Heiken Ashi Zone Trade Indicator smooths price action and highlights momentum shifts through colored candles.
Blue candles indicate bullish movement while brown candles indicate bearish movement.
This combination focuses on trading in the direction of the dominant trend while entering at the early stage of momentum continuation.
Buy Entry Rules
- Wait for the Forex Trend Rainbow Indicator to turn green, confirming a bullish trend.
- Wait for the first blue Heiken Ashi candle to appear.
- Enter a buy trade at the close of the blue candle.
- Place the stop loss below the most recent swing low or below the last brown candle structure.
- Close the trade when a brown Heiken Ashi candle appears or when the rainbow shifts to brown.
Sell Entry Rules
- Wait for the Forex Trend Rainbow Indicator to turn brown, confirming a bearish trend.
- Wait for the first brown Heiken Ashi candle to appear.
- Enter a sell trade at the close of the brown candle.
- Set the stop loss above the most recent swing high or above the last blue candle structure.
- Close the trade when a blue Heiken Ashi candle appears or when the rainbow shifts to green.
Case Study 1: EURGBP M15 Buy Setup
On EURGBP M15, the Forex Trend Rainbow Indicator turned green after a period of sideways movement, indicating that bullish pressure was starting to build.
Soon after, the Heiken Ashi Zone Trade Indicator printed its first blue candle, signaling a shift into upward momentum.
A buy trade was entered at the close of that candle.
The stop loss was placed below the recent swing low and under the last brown candle zone to protect against minor pullbacks.
4 hours later, the long trade was closed when a brown Heiken Ashi candle appeared, signaling a slowdown in bullish momentum.
Case Study 2: AUDJPY M5 Sell Setup
On AUDJPY M5, the Forex Trend Rainbow Indicator shifted to brown after rejecting a resistance area, confirming bearish market conditions.
The Heiken Ashi Zone Trade Indicator then printed its first brown candle, aligning with the trend direction.
A sell trade was entered at the close of that candle.
The stop loss was placed above the most recent swing high and slightly above the resistance level to allow for normal volatility.
Price moved downward with consistent bearish candles.
70 min later, the short trade was closed when a blue Heiken Ashi candle appeared, indicating that selling pressure was weakening.
Download Now
Trend Rainbow.mq5 Indicator (MT5)
FAQ
Can this indicator be used for multiple trading styles?
Yes. The Trend Rainbow works well for scalping, day trading, and swing trading on any instrument.
Can I customize the rainbow colors and lines?
Yes. You can adjust the up slope and down slope colors, line width, and line style to match your visual preference.
Which timeframes work best?
The indicator works on all timeframes, but lower timeframes are preferred for scalping, while higher timeframes are better for swing trading.
Does it provide entry and exit signals?
It shows trend direction visually. Traders should use their own strategies or additional tools for precise entries and exits.
Summary
The Trend Rainbow Indicator simplifies trend detection by transforming multiple moving averages into a colored rainbow.
Green indicates bullish momentum and brown indicates bearish momentum, helping traders follow trends across all instruments.
Its versatility makes it suitable for scalping, day trading, and swing trading.
Combined with proper stop loss and take profit placement, the indicator can enhance trade timing and risk management for traders at any skill level.