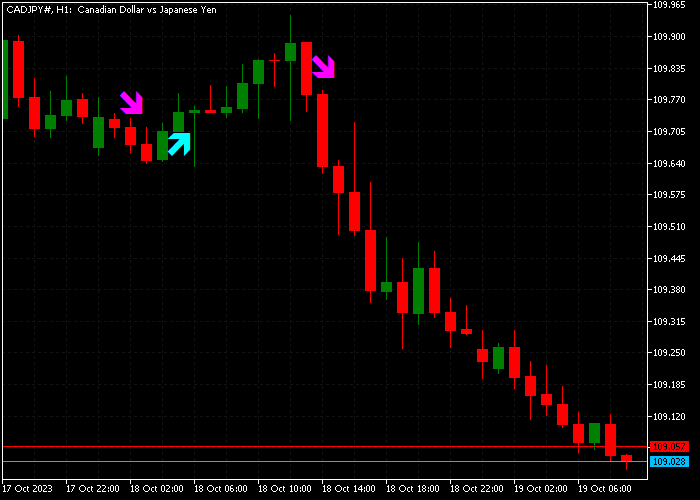
About the Heiken Ashi Zone Trade Indicator
The Heiken Ashi Zone Trade Indicator for MT5 is a trend identification tool that overlays modified Heiken Ashi candles directly onto the price area.
These candles smooth out short-term fluctuations and make prevailing market direction easier to read.
Blue Heiken Ashi candles represent bullish momentum. Brown candles indicate bearish pressure.
Gray candles signal a neutral or transition phase where the market lacks strong direction.
By filtering minor price noise, this indicator helps traders stay aligned with the broader move.
For stronger performance, it should be traded in agreement with the higher timeframe trend.
The style and color settings can be adjusted to match individual chart preferences.
Free Download
Heiken Ashi zone trade.mq5 Indicator (MT5)
Key Features
- Plots Heiken Ashi candles directly on the main price area.
- Blue candles highlight bullish market phases.
- Brown candles mark bearish market phases.
- Gray candles indicate neutral or consolidation zones.
- Helps smooth short-term volatility.
- Applicable to forex, indices, metals, and stocks.
Indicator Chart
The Heiken Ashi Zone Trade Indicator replaces standard candles with color-coded Heiken Ashi bars.
A sequence of blue candles reflects steady upward momentum, while consecutive brown candles confirm downside pressure.
Gray candles often appear during consolidation or before a potential trend shift.

Guide to Trade with Heiken Ashi Zone Trade Indicator
Buy Rules
- Wait for the first blue Heiken Ashi candle after a bearish or neutral phase.
- Enter a buy trade once the bullish candle closes.
- Confirm that the higher timeframe direction supports the upside bias.
- Hold the position while blue candles continue forming consecutively.
Sell Rules
- Wait for the first brown Heiken Ashi candle after a bullish or neutral phase.
- Initiate a sell trade once the bearish candle closes.
- Ensure the broader market context supports downside movement.
- Stay in the trade while brown candles remain dominant.
Stop Loss
- Place the stop loss below the most recent support area for buy trades.
- Place the stop loss above the most recent resistance area for sell trades.
- Adjust the stop distance according to current market volatility.
Take Profit
- Close the buy trade when the first brown candle appears.
- Close the sell trade when the first blue candle appears.
- Alternatively, target a minimum reward to risk ratio of 1.0.
Heiken Ashi Zone Trade Scalping Strategy for MT5 with CCI Divergence
This strategy combines the Heiken Ashi Zone Trade Indicator with the CCI Divergence Indicator to create a precise short term trading approach for M5 and M15 timeframes.
It focuses on catching early reversals within a clear trend structure.
The Heiken Ashi Zone Trade indicator smooths price action and highlights momentum using colored candles, making trends easier to follow and reducing market noise.
The CCI Divergence indicator identifies hidden shifts in momentum by spotting divergence between price and the oscillator, which often appears before reversals.
This combination works well because divergence provides early warning while Heiken Ashi confirms direction.
It helps traders avoid entering too early and instead wait for momentum to align with price.
This method is ideal for M5 and M15 charts and works best during active trading sessions where price moves with consistency.
Buy Entry Rules
- Wait for a blue bullish divergence arrow from the CCI Divergence indicator.
- Confirm that a blue Heiken Ashi candle forms after the divergence signal.
- Enter a buy trade at the close of the confirming candle.
- Place the stop loss below the low of the divergence formation or below the recent rejection wick.
- Take profit when a brown Heiken Ashi candle appears or when price stalls near a resistance level.
Sell Entry Rules
- Wait for a red bearish divergence arrow from the CCI Divergence indicator.
- Confirm that a brown Heiken Ashi candle forms after the divergence signal.
- Enter a sell trade at the close of the confirming candle.
- Place the stop loss above the high of the divergence structure or above a nearby consolidation zone.
- Take profit when a blue Heiken Ashi candle appears or when price hesitates near support.
Case Study 1: EURUSD M5 Bullish Reversal
On EURUSD M5 during the London session, price was trending downward but began to slow near a short term support area.
A blue bullish divergence arrow appeared from the CCI Divergence indicator, signaling weakening selling pressure.
Shortly after, a blue Heiken Ashi candle formed, confirming that buyers were stepping in.
A buy trade was executed at the close of that candle.
The stop loss was positioned below the recent wick where the divergence formed, allowing room for minor fluctuations.
Price shifted upward with a series of blue candles, reflecting a change in short term direction.
The trade remained active until a brown Heiken Ashi candle appeared, signaling that momentum was fading.
Case Study 2: GBPJPY M15 Bearish Reversal
On GBPJPY M15 during the New York session, price was climbing but began showing signs of exhaustion.
A red bearish divergence arrow appeared, indicating that upward momentum was weakening.
A brown Heiken Ashi candle followed, confirming a shift toward selling pressure.
A sell trade was entered at the candle close. Instead of placing the stop tightly, it was set above a nearby consolidation high, giving the setup more space to develop.
Price moved downward with consistent brown candles, aligning with the reversal signal.
The trade was exited once a blue Heiken Ashi candle appeared, suggesting that the bearish move was losing strength.
Download Now
Heiken Ashi zone trade.mq5 Indicator (MT5)
FAQ
What does the gray candle represent?
The gray candle signals a neutral phase where momentum is balanced. It often appears during consolidation or before a potential breakout.
Is this indicator better than standard Heiken Ashi?
This version emphasizes zone-based trend identification with distinct color phases. It simplifies recognition of trend transitions.
Can it be used alone?
It can generate standalone signals, but combining it with higher timeframe analysis improves trade selection and consistency.
Which markets work best with this tool?
It performs best in markets that show sustained directional movement.
Summary
The Heiken Ashi Zone Trade Indicator provides a simplified and disciplined way to follow trends.
Its color-coded candle system makes momentum shifts easy to identify.
By aligning entries with the dominant color phase and managing risk around key support and resistance levels, traders can capture trending moves with improved confidence and consistency.