
About the Zero Lag T3 Indicator
The Zero Lag T3 indicator for MT5 provides precise buy and sell signals suitable for scalpers and day traders.
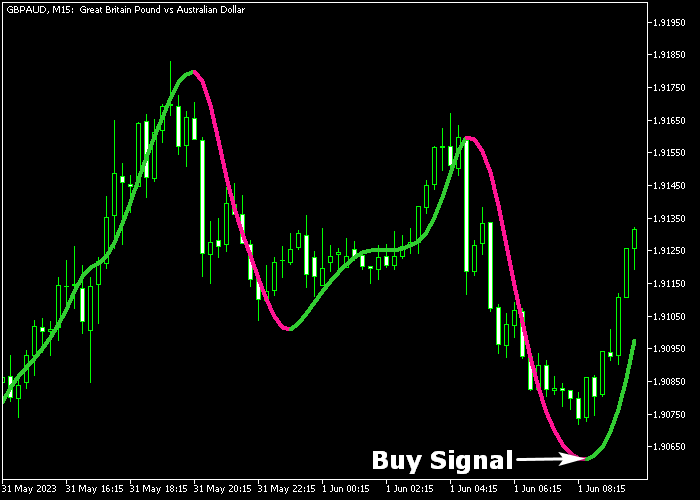
It appears directly on the price chart as two lines: green for bullish signals and violet for bearish signals.
When the green line forms, it indicates upward momentum and a potential buy opportunity.
When the violet line forms, it signals downward momentum and a potential sell opportunity.
This helps traders identify market trends quickly and make timely entries.
The indicator is fully customizable, with adjustable period, T3 hot, T3 type, applied price, and line colors.
It works best on lower-spread currency pairs during volatile trading hours, allowing traders to capture small but consistent profits.
By following the lines and monitoring short-term support and resistance levels, traders can make informed scalping and day trading decisions.
Free Download
Zero lag T3.mq5 Indicator (MT5)
Key Features
- Displays green line for bullish signals and violet line for bearish signals.
- Helps identify precise entry points for scalping and day trading.
- Fully adjustable settings: period, T3 hot, T3 type, price, and colors.
- Optimized for lower-spread pairs during volatile sessions.
- Tracks short-term momentum for accurate trade timing.
Indicator Chart
The Zero Lag T3 indicator is displayed on the main price chart as green and violet lines.
The green line signals bullish pressure and potential buy trades. The violet line signals bearish pressure and potential sell trades.
The chart clearly illustrates short-term trend direction, helping scalpers and day traders identify ideal entry points.
Guide to Trade with Zero Lag T3 Indicator
Buy Rules
- Wait for the green line to appear on the chart.
- Open a buy trade when the line confirms bullish pressure.
- Monitor the line for potential reversals or trend continuation.
Sell Rules
- Wait for the violet line to appear on the chart.
- Open a sell trade when the line confirms bearish pressure.
- Monitor the line for potential reversals or trend continuation.
Stop Loss
- For buy trades, place a stop loss below the nearest short-term support.
- For sell trades, place a stop loss above the nearest short-term resistance.
Take Profit
- Close buy trades for 10-25 pips or when the violet line appears.
- Close sell trades for 10-25 pips or when the green line appears.
- Follow line signals to avoid exiting too early or missing trend moves.
Zero Lag T3 Indicator MT5 Day Trading Strategy with Xmaster Formula Confirmation
This strategy combines the Zero Lag T3 Indicator with the Xmaster Formula Indicator to create a clean and responsive day trading system for M15 and H1 charts.
The Zero Lag T3 indicator is used to define trend direction with minimal delay.
A green line signals a bullish trend while a violet line indicates bearish pressure.
This helps traders stay aligned with fast market changes instead of reacting late to price movement.
The Xmaster Formula indicator provides confirmation signals using a simplified color system.
A green line indicates a buy signal, while a red line indicates a sell signal.
This strategy works best during active trading sessions such as London and New York.
Buy Entry Rules
- Wait for the Zero Lag T3 line to turn green, showing a bullish trend.
- Confirm that the Xmaster Formula shows a green signal line.
- Enter a buy trade at the close of the confirmation candle.
- Place the stop loss below the most recent swing low or below a minor consolidation zone.
- Trail the stop loss under recent swing structure as price continues upward.
- Exit the trade when the Xmaster Formula turns red or when the Zero Lag T3 line switches to violet.
Sell Entry Rules
- Wait for the Zero Lag T3 line to turn violet, showing a bearish trend.
- Confirm that the Xmaster Formula shows a red signal line.
- Enter a sell trade at the close of the confirmation candle.
- Place the stop loss above the most recent swing high or above a minor resistance zone.
- Trail the stop loss above recent swing structure as price moves downward.
- Exit the trade when the Xmaster Formula turns green or when the Zero Lag T3 line switches to green.
Case Study 1: Buy Trade Example (GBP/USD M15 London Session)
The Zero Lag T3 line turned green, confirming the start of a bullish intraday trend during the London session.
Shortly after, the Xmaster Formula printed a green signal line, confirming momentum in the same direction.
A buy trade was opened at the candle close with the stop loss placed below the recent swing structure.
Price continued moving upward in steady waves while pullbacks stayed shallow.
The trade was closed for 39 pips when the Xmaster Formula flipped to red and price started to lose momentum near a short-term resistance area.
Case Study 2: Sell Trade Example (USD/JPY H1 New York Session)
The Zero Lag T3 line switched to violet, showing a bearish trend developing during the New York session.
The Xmaster Formula then confirmed the move with a red signal line.
A sell trade was opened at the candle close with the stop loss placed above the most recent swing high.
Price moved lower with controlled retracements while staying below the trend line.
The trade was closed when the Xmaster Formula turned green and the Zero Lag T3 line began flattening, signaling that bearish momentum had ended.
Download Now
Zero lag T3.mq5 Indicator (MT5)
FAQ
How does the Zero Lag T3 indicate market trends?
The green line shows bullish pressure, while the violet line shows bearish pressure. Line appearance indicates a potential buy or sell entry.
Which settings affect the indicator’s responsiveness?
Period, T3 hot, T3 type, and applied price influence sensitivity. Adjust these for faster signals or smoother trends depending on your trading style.
What timeframe is recommended?
It works well for scalping and day trading on lower timeframes, particularly M1 and M5, but can also be applied to higher timeframes for trend analysis.
Summary
The Zero Lag T3 indicator provides fast and accurate buy and sell signals for scalpers and day traders.
Its green and violet lines make it easy to track short-term bullish and bearish pressure.
Fully adjustable settings allow traders to customize responsiveness and appearance for any instrument.
By following the lines and monitoring support and resistance levels, traders can enter trades with confidence and capture consistent profits during volatile market conditions.


