About the Zero Lag Hull Moving Average Indicator
The Zero Lag Hull Moving Average indicator for MT5 converts the traditional Hull MA into a zero lag trend-following tool that provides timely buy and sell signals.
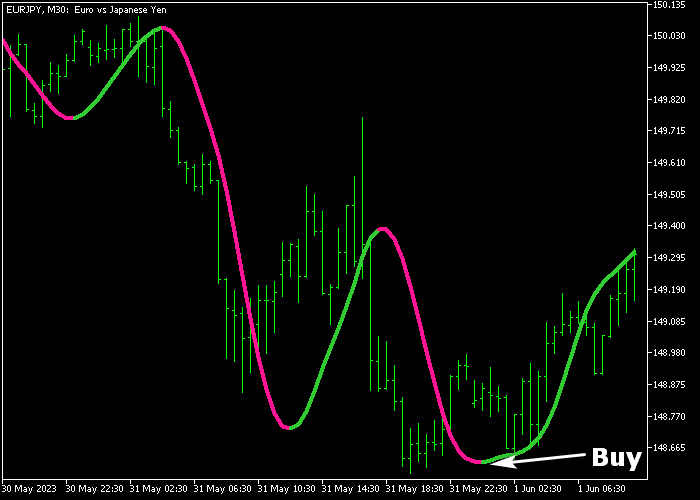
Displayed as a dual-colored line on the price chart, it shows green for bullish trends and violet for bearish trends.
The indicator is suitable for scalping, day trading, and swing trading, helping traders quickly identify trend direction and potential entries.
This technical tool is highly customizable, allowing adjustment of period and applied price.
Traders can use it as a standalone signal tool or combine it with other technical analysis methods for confirmation.
Its zero lag design ensures faster response to price changes, making it ideal for traders seeking precise entry and exit points on short or medium-term timeframes.
Free Download
Zero lag Hull average.mq5 Indicator (MT5)
Key Features
- Dual-colored moving average line: green for bullish trends, violet for bearish trends.
- Zero lag design delivers faster, more accurate trend signals.
- Customizable period and applied price for optimal responsiveness.
- Can be used as a standalone technical signal tool or combined with other indicators.
Indicator Chart
The Zero Lag Hull Moving Average is displayed directly on the price chart as a colored line.
Green indicates a bullish trend and a potential buy entry. Violet indicates a bearish trend and a potential sell entry.
Traders can quickly interpret trend direction and make decisions based on the line color and recent price movement.

Guide to Trade with Zero Lag Hull Moving Average Indicator
Buy Rules
- Wait for the green line to appear on the chart.
- Open a buy trade when the line signals bullish pressure.
- Monitor the line for changes indicating trend continuation or reversal.
Sell Rules
- Wait for the violet line to appear on the chart.
- Open a sell trade when the line signals bearish pressure.
- Monitor the line for changes indicating trend continuation or reversal.
Stop Loss
- For buy trades, place a stop loss a few pips below the previous swing low.
- For sell trades, place a stop loss a few pips above the previous swing high.
Take Profit
- Close buy trades at a fixed profit target or when the line turns violet.
- Close sell trades at a fixed profit target or when the line turns green.
- Follow the line and price action to optimize exit timing.
Zero Lag Hull Moving Average MT5 Scalping Strategy with Range Expansion Index Confirmation
This strategy combines the Zero Lag Hull Moving Average Indicator with the Range Expansion Index Indicator to create a fast scalping system designed for M5 and M15 charts.
The Zero Lag Hull Moving Average defines trend direction directly on the chart.
A green line shows bullish momentum while a violet line shows bearish conditions.
The Range Expansion Index works as a momentum confirmation tool.
When the histogram is above zero it signals bullish expansion, while values below zero indicate bearish pressure.
Used together, these indicators help traders avoid weak entries and focus only on active momentum phases during intraday trading sessions.
Buy Entry Rules
- Wait for the Zero Lag Hull Moving Average line to turn green, confirming bullish trend direction.
- Confirm that the Range Expansion Index histogram is above the zero level.
- Enter a buy trade at the close of the signal candle.
- Place the stop loss below the most recent swing low or below a minor support area.
- For active management, move the stop loss below the Zero Lag HMA line as price continues upward.
- Exit the trade when the HMA turns violet or when the Range Expansion Index drops below zero.
Sell Entry Rules
- Wait for the Zero Lag Hull Moving Average line to turn violet, confirming bearish trend direction.
- Confirm that the Range Expansion Index histogram is below the zero level.
- Enter a sell trade at the close of the signal candle.
- Place the stop loss above the most recent swing high or above a minor resistance area.
- Trail the stop loss above the Zero Lag HMA line as price moves lower.
- Exit the trade when the HMA turns green or when the Range Expansion Index rises above zero.
Case Study 1: Buy Trade Example (EUR/USD M5)
The Zero Lag Hull Moving Average shifted to green, showing the start of a short-term bullish phase during active trading hours.
Shortly after, the Range Expansion Index moved above zero, confirming that buying pressure was expanding.
A buy trade was opened at the candle close with the stop loss placed below the recent swing structure.
As price continued upward, the stop was trailed under the rising HMA line to lock in trend protection.
The long trade was closed when the HMA turned violet and the Range Expansion Index dropped back below zero, signaling that bullish momentum had ended.
Case Study 2: Sell Trade Example (GBP/JPY M15)
The Zero Lag Hull Moving Average turned violet, confirming bearish trend direction.
At the same time, the Range Expansion Index moved below zero, indicating strong downward momentum.
A sell trade was opened at the candle close with the stop loss placed above the most recent swing high.
Price continued to move lower in structured waves, and the stop was trailed above the HMA line as the trend developed.
The short trade was closed when the HMA switched back to green and the Range Expansion Index crossed above zero, showing that selling pressure had faded.
Download Now
Zero lag Hull average.mq5 Indicator (MT5)
FAQ
How does the Zero Lag Hull MA signal a trend?
The green line shows bullish trends and potential buy entries, while the violet line shows bearish trends and potential sell entries. The line color reflects short-term momentum.
Which settings control indicator responsiveness?
The period and applied price can be adjusted to make the line react faster or smoother. Shorter periods give quicker signals, longer periods smooth the trend.
Is it suitable for different trading styles?
Yes, it performs well for scalping, day trading, and swing trading, making it versatile for traders seeking trend-based entries.
Summary
The Zero Lag Hull Moving Average indicator provides a fast and reliable method to track market trends.
Its dual-colored line clearly shows bullish and bearish pressure, making it easy for traders to identify entry and exit points.
Adjustable settings allow for personalized responsiveness, and it works across all instruments and timeframes.
By following the line color and monitoring price action, traders can enter trades aligned with market momentum and capture consistent profits.