
About the MA Candles Indicator
The MA Candles Indicator for MT5 provides clear trend-following signals using color-coded candles plotted directly on the price chart.
It identifies bullish and bearish trends without repainting, giving traders reliable visual cues for entering and exiting trades.
Green MA candles appearing below the price suggest bullish momentum, while orange MA candles above the price indicate bearish pressure.
The indicator can be used alone as a trend-following system or in combination with other tools for more complex strategies.
Traders can adjust the MA period, method, shift, and candle colors to fit their trading style.
Short-term traders, especially scalpers and intraday participants, often benefit by using it during the London and New York sessions for higher liquidity and volatility.
Free Download
MA_Candles.mq5 Indicator (MT5)
Key Features
- Plots bullish and bearish MA-based trend candles directly on the chart.
- Signals do not repaint once they appear.
- Customizable MA period, method, shift, and candle colors.
- Works as a standalone trend tool or combined with other indicators.
- Optimized for scalping and intraday trading sessions.
Indicator Chart
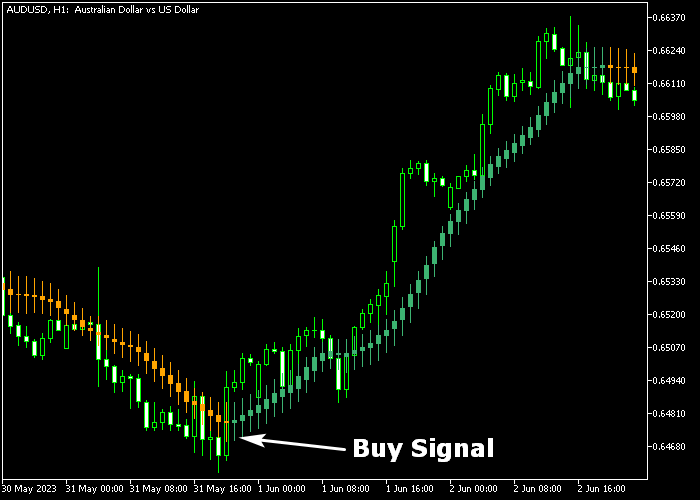
The MA Candles Indicator displays green and orange trend candles above and below the main price bars.
Green candles indicate bullish pressure and orange candles signal bearish momentum.
The first colored candle of a new trend acts as the initial trade signal for entry or exit decisions.
Guide to Trade with the MA Candles Indicator
Buy Rules
- Wait for the first green MA candle to appear below the price bar.
- Enter a buy position at the opening of the next candle.
- Maintain the position while green MA candles continue to form.
Sell Rules
- Wait for the first orange MA candle to appear above the price bar.
- Enter a sell position at the opening of the next candle.
- Maintain the position while orange MA candles continue to form.
Stop Loss
- For buy trades, position the stop below recent technical support.
- For sell trades, position the stop above recent technical resistance.
- Adjust position size based on distance to stop and account allocation.
Take Profit
- Exit buy trades when a valid orange candle appears above the candle.
- Exit sell trades when a valid green candle appears below the candle.
- Partial profits can be taken near intermediate support or resistance zones.
- Optionally trail the stop along candle formations during strong trends.
MA Candles Scalping Strategy with RSI Filter Indicator for MT5
This scalping strategy combines the MA Candles Indicator for MT5 with the RSI Filter Indicator for MT5 to capture short intraday momentum moves with clear trend confirmation and cleaner entry timing.
It is designed for M1 and M5 charts where price reacts quickly and structured confirmation is essential to avoid false signals.
The strategy works best during London and New York sessions when volatility is high and directional movement is more stable.
The MA Candles indicator defines trend direction through consecutive candle color behavior.
A sequence of green candles confirms bullish momentum while consecutive orange candles confirm bearish pressure.
The RSI Filter Indicator is used as a confirmation tool.
A green RSI filter bar signals buy conditions while a magenta bar signals sell pressure.
When both indicators align, scalping setups become more reliable and easier to execute.
Buy Entry Rules
- Wait for consecutive green candles on the MA Candles Indicator to confirm bullish trend direction.
- Confirm that the RSI Filter Indicator prints a green bar, showing supporting upward momentum.
- Enter a buy trade at the open of the next candle after both conditions align.
- Place stop loss below the most recent swing low or below the last cluster of orange candles.
- Take profit at the next resistance level or close the trade when MA Candles switch to orange or RSI Filter turns magenta, indicating a momentum reversal.
Sell Entry Rules
- Wait for consecutive orange candles on the MA Candles Indicator to confirm bearish trend direction.
- Confirm that the RSI Filter Indicator prints a magenta bar, showing supporting downside momentum.
- Enter a sell trade at the next candle open after both conditions align.
- Place stop loss above the most recent swing high or above the last cluster of green candles.
- Take profit at the next support level or close the trade when MA Candles switch to green or RSI Filter turns green, indicating a shift in momentum.
Case Study 1: GBPUSD Scalping Trade (M5, London Session)
GBPUSD formed a short consolidation during the London session before shifting into a clear bullish phase.
The MA Candles Indicator began printing consecutive green candles, confirming upward momentum.
Price structure supported the move with higher lows forming after the breakout.
Shortly after, the RSI Filter Indicator turned green, confirming bullish pressure.
A buy trade was entered on the next candle open.
Price continued higher with steady momentum and clean candle structure.
The buy trade was closed when MA Candles switched to orange after a failed push through resistance, signaling a short-term reversal in momentum.
Case Study 2: XAUUSD Scalping Trade (M1, New York Session)
Gold (XAUUSD) showed strong volatility during the New York session after a rejection from intraday highs.
The MA Candles Indicator began printing consecutive orange candles, confirming bearish structure and sustained selling pressure.
The RSI Filter Indicator followed with a magenta bar, confirming downside momentum.
A sell trade was executed at the next candle open. Price dropped quickly in a sharp impulse move with strong follow-through.
The short trade was closed when MA Candles turned green and RSI Filter switched to a green bar, indicating a shift back toward bullish momentum.
Download Now
MA_Candles.mq5 Indicator (MT5)
FAQ
Do MA Candles repaint after appearing?
No, once a candle is drawn, it remains fixed. This ensures that signals are reliable and do not change retroactively.
Which sessions are most effective for using this indicator?
Scalpers and intraday traders often benefit most during the London and New York sessions when liquidity and volatility are higher.
Can the indicator be used alone?
Yes, it can serve as a standalone trend-following system, but it can also be combined with other tools for confirmation or more complex strategies.
How customizable is the indicator?
Traders can adjust the MA period, method, shift, and bullish/bearish candle colors to suit their chart style and timeframe.
Summary
The MA Candles Indicator delivers trend-following signals using color-coded candles, making it easy to spot bullish and bearish shifts.
It simplifies trade decisions by highlighting the first candle of a new trend for entries and exits.
By combining its signals with a structured plan and monitoring session activity, traders can efficiently follow trends and capture price movements with clarity and precision.


