

About the MACD Crossing The Zero Level Candle Indicator
The MACD Crossing The Zero Level Candle Indicator for MT5 generates buy and sell signals based on the MACD crossing above or below the zero line.
It converts MACD momentum changes into colored candles, showing bullish or bearish shifts directly on the price chart.
A blue candle signals a change from bearish to bullish momentum, while a red candle signals a shift from bullish to bearish.
This approach allows traders to spot entry opportunities without monitoring multiple MACD lines or crossovers.
The indicator is fully customizable. Traders can adjust the fast and slow EMA periods, the signal SMA period, the applied price, and the zero-level crossing signal.
It works well as a standalone tool, suitable for both beginners and experienced traders, helping simplify trend-based entries.
Free Download
MACD Crossing the zero level (color candles).mq5 Indicator (MT5)
Key Features
- Blue candles signal bullish momentum from the MACD crossing above zero.
- Red candles signal bearish momentum from the MACD crossing below zero.
- Non-repainted candles for reliable signals.
- Fully customizable fast EMA, slow EMA, and signal SMA periods.
- Works directly on the price chart for easy entry visualization.
- Suitable as a standalone trend-following tool.
Indicator Chart
The MACD Crossing The Zero Level Candle Indicator appears directly on the main price chart.
Blue and red candles indicate bullish and bearish shifts based on MACD zero crossings.
Traders can use these candles to quickly spot potential entries and exits aligned with momentum changes.
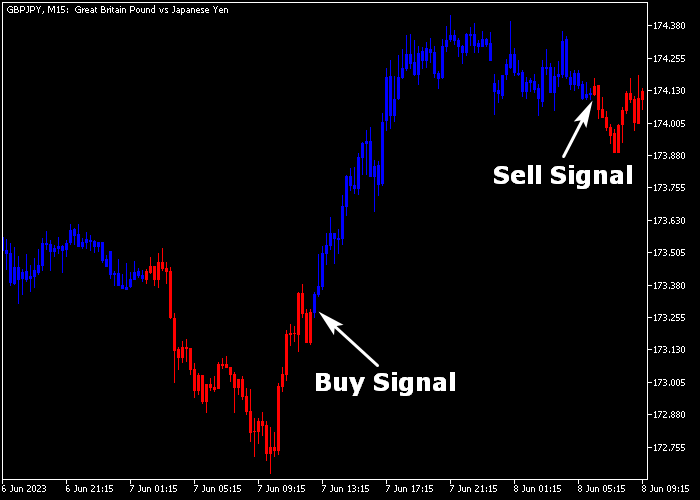
Guide to Trade with MACD Crossing The Zero Level Candle Indicator
Buy Rules
- Observe the chart for a blue candle forming after the MACD crosses above zero, signaling bullish momentum.
- Check if price has recently bounced off a support level or is forming higher lows.
- Enter a buy trade near the candle close to capture the start of the bullish move.
Sell Rules
- Watch for a red candle appearing after the MACD crosses below zero, indicating bearish momentum.
- Ensure price is approaching resistance or forming lower highs for a stronger signal.
- Open a sell trade at the close of the red candle to follow the new bearish momentum.
Stop Loss
- For buy trades, set your stop loss below the most recent support level.
- For sell trades, set your stop loss above the most recent resistance level.
- Trail your stop along new candles that confirm the trend to lock in gains.
Take Profit
- Close buy trades when the first red candle appears.
- Close sell trades when the first blue candle appears.
- Optionally, set a fixed profit target using your preferred risk-to-reward ratio.
MACD Crossing Zero Level Candle MT5 Strategy with Zone Trade Histogram Scalper
This scalping strategy combines the MACD Crossing the Zero Level Candle Indicator with the Zone Trade Histogram Scalper Indicator to build a fast and reactive trading system for M1 and M5 charts.
The MACD candle indicator shows trend direction through consecutive blue candles for bullish momentum and red candles for bearish momentum.
The Zone Trade Histogram Scalper adds timing precision using blue bars for buy signals and the first orange bar for sell signals.
This strategy focuses on catching short bursts of momentum during active market hours.
It works best when price is moving with clear direction and avoids sideways conditions where MACD candles frequently alternate colors.
The combination helps filter entries by requiring both trend continuity and fresh momentum confirmation.
Buy Entry Rules
- Wait for consecutive blue candles from the MACD Crossing Zero Level Candle Indicator, confirming bullish trend continuation.
- Confirm a blue histogram bar from the Zone Trade Histogram Scalper Indicator as a fresh buy signal.
- Enter a buy trade at the close of the signal candle once both conditions align.
- Place the stop loss below the most recent micro swing low.
- Exit the trade when the Zone histogram prints an orange bar or when MACD candles turn red, indicating momentum loss.
Sell Entry Rules
- Wait for consecutive red candles from the MACD Crossing Zero Level Candle Indicator, confirming bearish trend continuation.
- Confirm the first orange histogram bar from the Zone Trade Histogram Scalper Indicator as a sell signal.
- Enter a sell trade at the close of the signal candle once both conditions agree.
- Place the stop loss above the most recent micro swing high.
- Exit the trade when the Zone histogram turns blue or when MACD candles switch to blue, signaling weakening bearish momentum.
Case Study 1: EURUSD M1 Scalping Buy
On EURUSD M1, price moved out of a short consolidation phase and printed a series of consecutive blue candles from the MACD Crossing Zero Level Candle Indicator.
This showed that bullish momentum was starting to build and remain consistent.
Shortly after, the Zone Trade Histogram Scalper printed a blue bar, confirming a fresh buy signal aligned with the ongoing momentum.
A buy trade was entered at the close of the signal candle once both indicators aligned in direction and timing.
Price continued to move upward in short bursts with small retracements, typical of EURUSD during active sessions.
As momentum started to slow and the Zone histogram shifted to orange, the setup was considered complete and the trade was closed based on loss of continuation pressure.
Case Study 2: GBPJPY M5 Scalping Sell
On GBPJPY M5, price attempted to extend higher but failed to maintain bullish sentiment, resulting in a transition to consecutive red candles from the MACD indicator.
This shift indicated growing bearish control in the market.
The Zone Trade Histogram Scalper then printed its first orange bar, confirming a sell opportunity aligned with momentum direction.
A sell trade was executed at candle close once both signals matched.
Price dropped sharply in typical GBPJPY fashion with quick swings and strong downward pushes.
As the Zone histogram switched back to blue and MACD candles began alternating, the bearish momentum faded and the short trade was exited for a 32 pip gain.
Download Now
MACD Crossing the zero level (color candles).mq5 Indicator (MT5)
FAQ
How does the indicator identify market momentum?
It tracks when the MACD line crosses the zero level, turning the next candle blue for bullish momentum or red for bearish momentum, helping traders follow momentum shifts.
Can I combine it with other indicators for confirmation?
Yes, pairing it with support/resistance levels, trendlines, or oscillators can help validate entries and filter weaker signals.
Is this indicator suitable for short-term trading?
Yes, it works on lower timeframes like M1 or M5, providing fast signals. Traders should manage risk carefully as shorter timeframes can produce more frequent alerts.
How do I adjust the sensitivity of the signals?
You can change the fast EMA, slow EMA, and signal SMA periods to make the candles respond faster or slower to MACD zero crossings based on your strategy.
Summary
The MACD Crossing The Zero Level Candle Indicator simplifies trend following by converting MACD zero line crossings into colored candles.
Blue and red candles highlight bullish and bearish momentum shifts, allowing traders to spot potential trade entries and exits instantly.
Customizable settings for EMA and signal periods make it adaptable to any trading style or timeframe.
It works as a standalone tool, ideal for beginners and experienced traders alike, helping reduce analysis time and improve trading efficiency.





