
About the VWAP Bands Indicator
The VWAP Bands Indicator for MT5 is a trend-following tool that combines price action with volume-weighted averages to provide trade entries and market direction.
It is widely used in buy-on-dips and sell-on-rallies strategies, making it suitable for both intraday and swing trading.
The indicator displays green and brown bands directly on the main chart.
Green bands function as dynamic resistance, while brown bands serve as support.
A gray dashed line in the center marks the reference point for initiating trades along the trend.
Upward-sloping bands indicate bullish conditions, and downward-sloping bands indicate bearish trends.
Traders can customize the volume-weighted average period, price source, use of real volume, and deviation settings to adjust sensitivity to market movements.
Free Download
vwap_bands.mq5 Indicator (MT5)
Key Features
- Volume-weighted bands to identify trend direction.
- Green bands act as dynamic resistance levels.
- Brown bands act as dynamic support levels.
- Gray dashed line marks trade entry reference points.
- Customizable VWAP period, price, deviation, and volume settings.
- Suitable for standalone use or as part of a trend-following strategy.
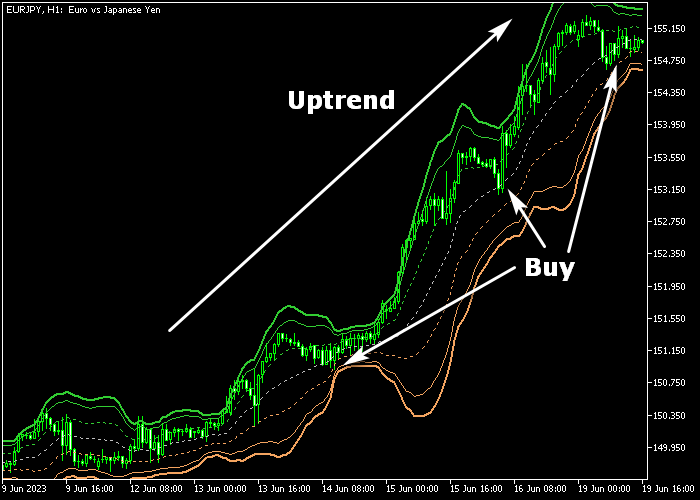
Indicator Chart
The VWAP Bands Indicator is displayed on the main chart with green and brown bands highlighting dynamic resistance and support levels.
Upward-sloping bands indicate bullish trends, while downward-sloping bands indicate bearish trends.
The gray dashed line helps identify potential buy or sell entry points.
Guide to Trade with VWAP Bands Indicator
Buy Rules
- Wait for the VWAP Bands to slope upwards, indicating a bullish trend.
- Enter a buy trade when a candle touches the gray dashed line from above.
- Confirm price is supported by the brown VWAP band or short-term support.
- Check momentum and trend alignment on your chosen timeframe.
Sell Rules
- Wait for the VWAP Bands to slope downwards, indicating a bearish trend.
- Enter a sell trade when a candle touches the gray dashed line from below.
- Confirm price is resisted by the green VWAP band or short-term resistance.
- Ensure downward momentum aligns with the broader trend.
Stop Loss
- For buy trades, place the stop loss below the brown VWAP band.
- For sell trades, place the stop loss above the green VWAP band.
- Adjust stops according to market volatility and swing levels.
- Keep stop placement consistent with your risk strategy.
Take Profit
- Target a minimum risk-to-reward ratio of 1.5 for all trades.
- Close buy trades if price fails to maintain above the gray dashed line or brown band.
- Close sell trades if price fails to maintain below the gray dashed line or green band.
- Optionally, trail profits along the bands as the trend develops.
VWAP Bands London & US Session MT5 Strategy with Strength Index Signal
This strategy combines the VWAP Bands Indicator with the Strength Index Signal V1.0 Indicator to capture high‑probability intraday moves on M5 and M15 charts.
It focuses on using trend direction from the bands together with precise signal arrows for trade timing during the London and US sessions.
The VWAP Bands indicator shows a volume‑weighted average price line flanked by bands that reflect volatility and trend direction.
When the bands slope upward, bullish pressure is present. When the bands slope downward, bearish pressure is present.
The Strength Index Signal indicator provides clean entry arrows.
A blue arrow generates a buy signal, while a red arrow generates a sell signal.
This approach works best during the London and New York sessions when volatility and volume create meaningful directional moves.
It suits scalpers and short‑term traders who want clear entry and exit rules with trend context.
Buy Entry Rules
- Confirm that the VWAP Bands are sloping upward on the M5 or M15 chart.
- Wait for a blue arrow from the Strength Index Signal indicator.
- Enter a buy trade at the opening of the next candle after the arrow appears.
- Place stop loss below the recent swing low or the lower VWAP band.
- Take profit near recent resistance or when a red arrow appears.
Sell Entry Rules
- Confirm that the VWAP Bands are sloping downward on the M5 or M15 chart.
- Wait for a red arrow from the Strength Index Signal indicator.
- Enter a sell trade at the opening of the next candle after the arrow appears.
- Place stop loss above the recent swing high or the upper VWAP band.
- Take profit near recent support or when a blue arrow appears.
Case Study 1: EURUSD M5 Bullish Break
On EURUSD M5 during the London session, the VWAP Bands turned upward following a breakout from a brief consolidation.
The bands maintained their upward slope, indicating strong intraday bullish pressure.
Shortly thereafter, a blue arrow appeared from the Strength Index Signal indicator.
A buy trade was entered at the next candle. The stop loss was placed below the lower VWAP band.
Price continued higher with decisive bullish candles.
The long trade was closed near a recent resistance level when a red arrow appeared from the Strength Index Signal indicator.
Case Study 2: USDJPY M15 Downtrend Continuation
On USDJPY M15 during the US session, the VWAP Bands sloped downward after a failed rally earlier in the day.
This suggested that sellers were in control. A red arrow appeared from the Strength Index Signal indicator just after a minor pullback.
A sell trade was opened at the next candle with a stop loss above the recent swing high.
Price continued its descent over the following candles.
The trade was closed when a blue arrow appeared, locking in a small intraday gain near a support area.
Download Now
vwap_bands.mq5 Indicator (MT5)
FAQ
How do the VWAP bands indicate trend direction?
Upward-sloping bands signal bullish trends, while downward-sloping bands signal bearish trends.
The angle and slope help confirm market momentum.
Can the gray dashed line be used as the main entry point?
Yes. It acts as a reference for entering trades in the direction of the trend, especially when price interacts with it during pullbacks or rallies.
Which settings affect sensitivity the most?
The VWAP period and deviation are the most influential.
Lower periods respond faster to price changes, while higher periods smooth the bands for stronger trend confirmation.
Can this indicator work alone?
Yes. It can function as a standalone trend-following tool, although combining it with other indicators may improve confirmation and reduce false signals.
Summary
The VWAP Bands Indicator simplifies trend trading by combining dynamic support and resistance bands with a reference line for entry signals.
It allows traders to identify bullish and bearish conditions and trade in line with prevailing momentum.
Its adjustable settings make it flexible across instruments and timeframes, while the visual bands provide clear guidance for spotting trade opportunities and potential trend reversals.


