About the 3 Level ZZ Semafor Indicator
The 3 Level ZZ Semafor indicator for MT5 is a sophisticated technical tool designed to identify significant market turning points.
It operates by scanning price action across three distinct periods to find peaks and troughs.
This indicator is particularly effective for traders specializing in swing trading or for those looking to catch the start of a new trend.
While it provides immediate feedback on price extremes, it works best when you understand the broader market context.
Integrating this tool into a balanced trading system helps you avoid entering trades during choppy, sideways markets.
Free Download
3_level_zz_semafor.mq5 Indicator (MT5)
Key Features
- Multi-period analysis tracks price movements across three different sensitivity levels simultaneously.
- The indicator identifies short-term, medium-term, and long-term swing points on a single chart.
- Adjustable parameters for periods and backstep allow you to customize the tool for different timeframes.
- Clear, color-coded dots distinguish potential bullish and bearish reversal zones.
- The logic is based on the proven zigzag concept, making it a reliable choice for technical analysis.
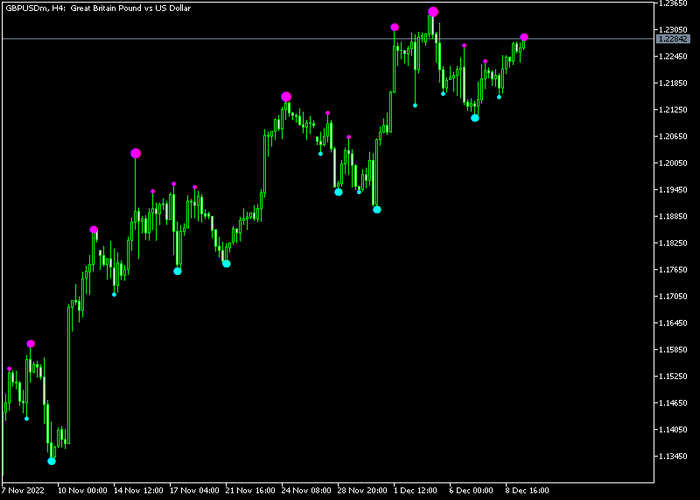
Indicator Chart
The chart displays the 3 Level ZZ Semafor indicator actively tracking price action on a 4-hour timeframe.
You can see how the light-blue and purple dots appear at the extreme highs and lows of the price waves.
These markings help traders identify where the current momentum might be exhausting, suggesting a change in direction.

Guide to Trade with 3 Level ZZ Semafor Indicator
Buy Rules
- Verify that the overall market sentiment is trending upward or recovering from a deep low.
- Wait for a light-blue colored dot to appear at the bottom of a price retracement.
- Execute a buy order once the candle associated with the light-blue dot has fully closed.
- Ensure there is enough room for price to move toward the previous swing high.
Sell Rules
- Confirm that the broader market trend is currently moving in a downward direction.
- Look for a purple colored dot to manifest at the peak of a temporary price rally.
- Open a sell position immediately after the candle with the purple dot finishes forming.
- Check that the risk-to-reward ratio remains favorable before entering the market.
Stop Loss
- For buy trades, place your stop loss a few pips below the most recent swing low.
- For sell trades, set the stop loss slightly above the most recent swing high.
- Always prioritize capital preservation by using a fixed stop loss on every execution.
Take Profit
- Aim for a minimum risk-to-reward ratio of 1.5 to ensure long-term profitability.
- Consider closing half of the position when price reaches the next major support or resistance level.
- Use a trailing stop to lock in gains as the trade moves in your favor.
- Exit the trade manually if a signal of the opposite color appears on the chart.
3 Level ZZ Semafor Scalping Strategy for MT5
This strategy combines the 3 Level ZZ Semafor Indicator and the MAMA Indicator to create a fast-reacting scalping method for M5 and M15 charts.
It focuses on catching short-term reversals while staying aligned with the underlying trend.
The 3 Level ZZ Semafor highlights potential turning points using colored dots.
These signals often appear near local highs and lows, making them useful for timing entries.
The MAMA indicator uses two adaptive moving averages, the faster MAMA line and the slower FAMA line.
When the green MAMA line crosses above the red FAMA line, it signals a shift toward bullish conditions.
When it crosses below, it reflects bearish pressure.
This combination allows traders to filter reversal signals and only take trades in the direction of the dominant trend.
It works effectively during active sessions and suits traders looking for consistent intraday opportunities.
Buy Entry Rules
- Wait for a light-blue dot to appear from the 3 Level ZZ Semafor.
- Confirm that the green MAMA line is above the red FAMA line.
- Ensure the crossover has already happened or is clearly established.
- Enter a buy trade at the opening of the next candle.
- Place the stop loss below the recent swing low formed near the dot.
- Take profit when a purple dot appears or when MAMA starts turning downward.
Sell Entry Rules
- Wait for a purple dot to appear from the 3 Level ZZ Semafor.
- Confirm that the green MAMA line is below the red FAMA line.
- Ensure price is moving with bearish momentum.
- Enter a sell trade at the opening of the next candle.
- Set the stop loss above the recent swing high formed near the dot.
- Take profit when a light-blue dot appears or when MAMA begins to turn upward.
Case Study 1: M5 Quick Reversal Trade
On EURCHF M5 during the London session, price pulled back within an overall uptrend.
A light-blue dot appeared, indicating a potential buy setup.
At the same time, the MAMA line remained above the FAMA line, confirming bullish direction.
A buy trade was entered at the next candle. The stop loss was placed below the recent low.
Price reacted quickly and pushed higher as buyers stepped back in.
The trade was closed for 19 pips when a purple dot formed, signaling a possible short-term reversal.
Case Study 2: M15 Trend-Based Entry
On GBPCHF M15 during the New York session, price was trending downward.
A purple dot appeared near a minor retracement, signaling a sell opportunity.
The MAMA line was below the FAMA line, confirming the downtrend.
A sell trade was opened after the signal candle closed. The stop loss was placed above the recent high.
Price continued dropping steadily with strong bearish candles.
The position was closed when a light-blue dot appeared, capturing a clean move within the trend.
Download Now
3_level_zz_semafor.mq5 Indicator (MT5)
FAQ
How do the three levels of the Semafor differ in sensitivity?
The indicator uses three internal periods to calculate price extremes.
Level 1 reacts to small price changes, Level 2 covers medium swings, and Level 3 identifies major trend reversals.
Most traders focus on the Level 3 signals as they represent the strongest potential shifts in market direction.
Can I change the colors of the dots in the settings?
Yes, you can modify the colors in the inputs tab to match your chart template.
Which timeframes are most effective for this strategy?
While the indicator works on all timeframes, it is most reliable on the 15-minute, 1-hour, and 4-hour charts.
Lower timeframes like the 1-minute chart can produce too many signals due to market noise, which may lead to false entries if not filtered correctly.
Summary
The 3 Level ZZ Semafor indicator provides a streamlined approach to technical analysis by merging trend detection with momentum filtering.
It allows traders to navigate different market conditions by visually separating bullish impulses from bearish pressure.
Because the signals do not repaint once the leg is fully established and the next starts, the tool remains a reliable choice for those executing fast-paced strategies like scalping or day trading.


