
About the Breakout Bars Trend Indicator
The Breakout Bars Trend Indicator for MT5 is built around a proprietary price breakout method designed to highlight strong momentum expansions.
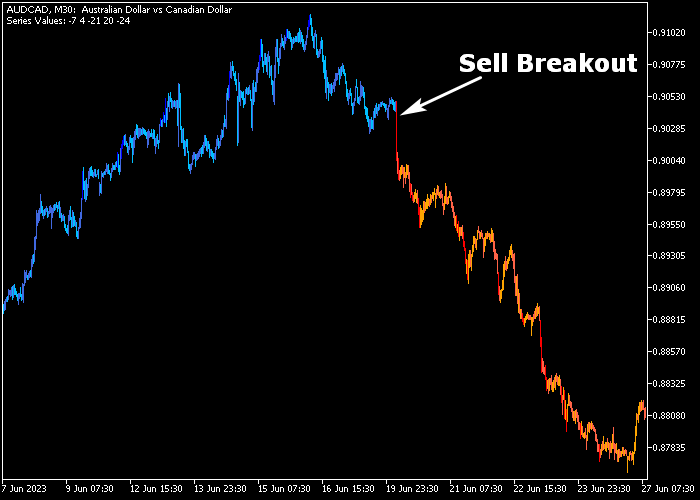
Instead of traditional arrows or lines, it prints colored breakout candles directly on the price chart.
Blue candles represent bullish breakout pressure, while red candles indicate bearish breakout activity.
These colored bars appear when price pushes beyond recent boundaries with strength, signaling potential continuation moves.
The indicator allows full customization of delta, series size display, and number of series.
This flexibility lets traders adjust sensitivity depending on volatility and timeframe.
It works across all instruments available on the MetaTrader 5 platform, including forex pairs, indices, and commodities.
Free Download
breakoutbarstrend.mq5 Indicator (MT5)
Key Features
- Proprietary breakout-based signal generation.
- Blue candles for bullish breakout entries.
- Red candles for bearish breakout entries.
- Adjustable delta and breakout sensitivity.
- Customizable number and size of signal series.
Indicator Chart
The Breakout Bars Trend Indicator appears directly on the main price area as blue and red colored breakout candles.
Blue candles highlight strong upward price expansions beyond recent levels.
Red candles mark decisive downward breakout pressure.
Each colored bar signals potential trend continuation following consolidation or range conditions.
Guide to Trade with Breakout Bars Trend Indicator
Buy Rules
- Wait for a blue breakout candle to close on the chart.
- Confirm that the breakout occurs above a recent consolidation range.
- Enter a buy position at the open of the next candle.
- Avoid entries if the breakout forms directly into higher timeframe resistance.
Sell Rules
- Wait for a red breakout candle to close on the chart.
- Confirm that the breakout occurs below a recent support zone.
- Enter a sell position at the open of the next candle.
- Avoid entries if the breakout forms directly into higher timeframe support.
Stop Loss
- For buy trades, position the stop below the breakout candle low or recent swing low.
- For sell trades, position the stop above the breakout candle high or recent swing high.
- Base lot size on the distance between the entry and stop level.
Take Profit
- Exit the buy trade when a red breakout candle appears.
- Exit the sell trade when a blue breakout candle appears.
- Alternatively, trail profits behind new higher lows or lower highs.
- You may also secure gains at predefined volatility-based targets.
Breakout Bars Trend Reversal MT5 Strategy with Super Arrow Buy Sell
This strategy combines the Breakout Bars Trend Indicator with the Super Arrow Buy Sell Indicator to build a trend reversal system suited to identifying powerful turning points.
Breakout Bars focuses on initial trend direction by highlighting breakout candles that signal potential new trend beginnings.
The Super Arrow then confirms with directional arrows when a reversal is ready to take shape.
Instead of trading every breakout, this strategy waits for signs that the trend is losing steam and reversing.
It works well on H1 and H4 charts where trend reversals tend to unfold with better clarity compared to faster timeframes.
Buy Entry Rules
- Wait for a blue breakout candle from the Breakout Bars Trend Indicator, signaling that the existing downtrend is potentially exhausting.
- Confirm the reversal with a blue arrow from the Super Arrow Buy Sell Indicator.
- Enter a buy trade at the close of the confirmation candle.
- Place the stop loss below the recent swing low or below the breakout level.
- Take profit at the next resistance area or when a red arrow appears.
- You can also trail the stop as the new trend gains strength.
Sell Entry Rules
- Wait for a red breakout candle from the Breakout Bars Trend Indicator, showing that the prior uptrend may be losing upward momentum.
- Confirm the reversal with a red arrow from the Super Arrow Buy Sell Indicator.
- Enter a sell trade at the close of the confirmation candle.
- Place the stop loss above the recent swing high or above the breakout level.
- Take profit near the next key support level or when a blue arrow appears.
- A trailing stop can help lock in gains as the move continues.
Case Study 1: EURUSD H1 Reversal
On the EURUSD H1 chart, price had been trending lower when a strong blue breakout candle emerged, marking a potential shift in momentum.
Shortly thereafter, price stalled and a blue arrow formed from the Super Arrow Buy Sell Indicator, signaling a reversal opportunity.
A buy trade was taken at the close of the confirming blue arrow candle with a stop placed just below the recent low.
After entry, price climbed steadily in a series of higher candles, typical of a developing reversal.
The gain was locked in near a known resistance zone before any red signals appeared.
Case Study 2: GBPCHF H4 Turn
On GBPCHF H4, the market had been pushing higher before a red breakout candle signaled that trend strength was peaking.
After a small pullback, the Super Arrow displayed a red arrow, confirming a bearish reversal setup.
A sell trade was opened at the candle close with the stop above the swing high.
Price moved lower in a controlled fashion, breaking support levels and offering a clean reversal.
Partial profits were taken at intermediate support before strength returned to the downside, capturing a meaningful trend shift.
Download Now
breakoutbarstrend.mq5 Indicator (MT5)
FAQ
What does the delta setting control?
The delta parameter adjusts how sensitive the indicator is to price expansion.
Higher values filter minor moves, while lower values generate more frequent breakout signals.
Can this indicator be used for scalping?
Yes, scalpers often apply it during the London and American sessions when volatility increases.
Strong session momentum improves breakout follow-through.
Does it repaint past breakout candles?
No, once a breakout candle closes and is printed in blue or red, the signal remains fixed on the chart.
Is it suitable for ranging markets?
It performs best after consolidation phases that lead into expansion moves.
During tight sideways ranges, false breakouts may occur more frequently.
Summary
The Breakout Bars Trend Indicator focuses on price expansion and momentum continuation.
Its colored breakout candles provide direct and easy-to-read entry signals.
With adjustable sensitivity and compatibility across all MT5 instruments, it adapts to various trading styles.
Traders can apply it to capture impulsive moves following consolidation and align entries with strong session volatility.


