
About the Blau T3 Ergodic Oscillator 1.02
The Blau T3 Ergodic Oscillator 1.02 for MT5 is a momentum-based indicator built to deliver continuous buy and sell signals.
It applies the T3 smoothing technique to reduce noise while maintaining responsiveness to price changes.
The oscillator is displayed in a separate window beneath the main price area as a two-color filled signal line fluctuating around the zero level.
A green line above zero reflects bullish momentum, while a red line below zero signals bearish pressure.
Its calculation relies on T3 period 1, T3 period 2, and a T3 signal line period.
Traders can also adjust the display style and Tim Tillson calculation settings.
These inputs allow fine-tuning based on timeframe and volatility conditions.
Free Download
Blau_-_T3_ergodic_candlestick_oscillator_1.02.mq5 Indicator (MT5)
Key Features
- Zero-line based momentum oscillator.
- Green filled line for bullish signals.
- Red filled line for bearish signals.
- T3 smoothing for reduced market noise.
- Customizable T3 and signal line periods.
- Suitable for trending and active market phases.
Indicator Chart
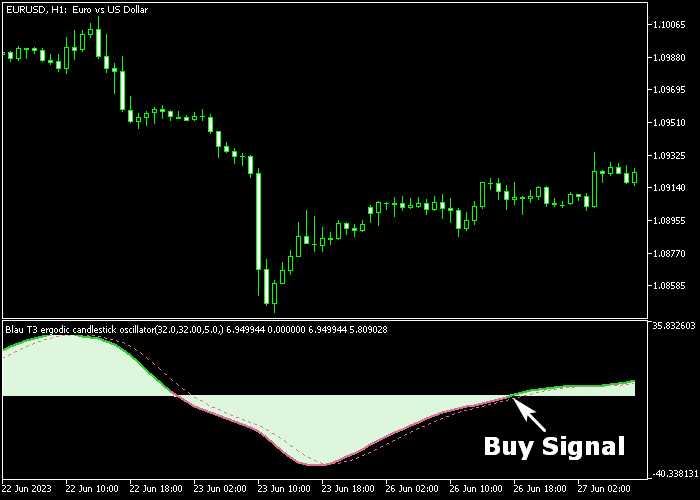
The Blau T3 Ergodic Oscillator 1.02 appears in a lower window as a smooth two-color filled line oscillating above and below zero.
When the line holds above zero in green, bullish momentum dominates.
When it remains below zero in red, bearish pressure controls the market.
Guide to Trade with Blau T3 Ergodic Oscillator 1.02
Buy Rules
- Wait for the oscillator line to turn green and move above the 0 level.
- Confirm the candle closes with the oscillator clearly positioned above zero.
- Open a buy trade at the start of the next candle.
- Prefer setups that align with an upward higher timeframe bias.
Sell Rules
- Wait for the oscillator line to turn red and move below the 0 level.
- Confirm the candle closes with the oscillator clearly positioned below zero.
- Open a sell trade at the start of the next candle.
- Prefer setups that align with a downward higher timeframe bias.
Stop Loss
- For buy trades, place the stop slightly below the previous swing low.
- For sell trades, place the stop slightly above the previous swing high.
- Calculate position size according to stop distance.
Take Profit
- Close the buy trade when the Blau T3 oscillator crosses back below zero.
- Close the sell trade when the Blau T3 oscillator crosses back above zero.
- Alternatively, exit the trade for a fixed pip profit target.
Blau T3 Ergodic Oscillator MT5 Strategy with Bollinger Bands Indicator
This strategy blends the Blau T3 Ergodic Oscillator with the Bollinger Bands Indicator to capture momentum‑aligned moves during the London and New York sessions.
The Blau T3 oscillator highlights shifts in buying and selling pressure, while the slope of the Bollinger Bands helps confirm whether the trend is bullish or bearish.
During London and New York hours, liquidity and volatility increase, creating ideal conditions for momentum trades that follow short‑to‑medium swings.
This strategy fits traders who want clear trend direction combined with momentum confirmation before entering and exiting trades.
This setup works best on M5, M15, and M30 charts during the core hours of the London session (08:00–12:00 GMT) and New York session (13:30–17:00 GMT).
Price action during these times is usually more responsive to momentum and trend filters.
Buy Entry Rules
- Confirm that the Bollinger Bands are sloping upward, showing a prevailing bullish trend.
- Wait for the Blau T3 Ergodic Oscillator histogram line to turn green, signaling rising buying momentum.
- Enter a buy trade at the close of the confirming candle.
- Place the stop loss just below the recent swing low or below the lower Bollinger Band.
- Close the trade when the histogram turns red or when the Bollinger Bands flatten or begin to slope downward.
- You can also take profit as price approaches the upper band.
Sell Entry Rules
- Confirm that the Bollinger Bands are sloping downward, indicating bearish trend conditions.
- Wait for the Blau T3 Ergodic Oscillator histogram line to turn red, signaling growing selling momentum.
- Enter a sell trade at the close of the confirming candle.
- Place the stop loss just above the recent swing high or above the upper Bollinger Band.
- Close the trade when the oscillator turns green or when the Bollinger Bands flatten or shift upward.
- You can also take profit near the lower band.
Case Study 1: GBPUSD M15 during London Session
On the GBPUSD M15 chart during the early London session, the Bollinger Bands were sloping upward after price held above the middle band following a break from a short consolidation.
This showed an emerging bullish bias.
Shortly after, the Blau T3 Ergodic Oscillator histogram turned green from below, indicating fresh buying momentum in line with the trend.
A buy trade was taken at the candle close with the stop loss below a recent minor swing low.
Price continued to climb throughout the session, with waves of strong bullish candles pushing toward the upper band.
The trade was exited when the histogram dropped back toward red and the bands began to flatten, capturing a solid move aligned with the London session momentum.
Case Study 2: USDCHF M30 during New York Session
On the USDCHF M30 chart later in the New York session, the Bollinger Bands began sloping downward after price failed to hold above the middle band.
This setup indicated a growing bearish trend.
The Blau T3 Ergodic Oscillator confirmed selling pressure as its histogram turned red.
A sell trade was entered at the close of the confirming candle with a stop loss above the recent swing high.
Price proceeded lower with smooth moves typical of persistent selling during the New York session.
The position was taken off when the histogram turned green and the bands started to flatten, securing a strong intraday decline.
Download Now
Blau_-_T3_ergodic_candlestick_oscillator_1.02.mq5 Indicator (MT5)
FAQ
What makes the Blau T3 Ergodic different from a standard oscillator?
It uses T3 smoothing, developed by Tim Tillson, to reduce erratic price fluctuations.
This creates a smoother signal line while still reacting to meaningful momentum shifts.
Which T3 period settings should I use?
Shorter periods increase sensitivity and generate more signals.
Longer periods smooth the oscillator and suit traders who prefer fewer but stronger trend confirmations.
Does this indicator perform well in sideways markets?
Like most momentum oscillators, it performs better during trending conditions.
In ranging markets, combining it with support and resistance analysis improves selectivity.
Summary
The Blau T3 Ergodic Oscillator 1.02 for MT5 provides smooth and consistent momentum signals based on T3 calculations.
Its zero-line logic keeps entries and exits straightforward.
With adjustable parameters and continuous signal generation, it adapts to different trading speeds.
Traders can apply it as a primary momentum tool or combine it with price action for stronger confirmation.


