About the BSI Trend Indicator
The BSI Trend Indicator Version 1.1 for MT5 is a trend-following tool that combines a Linear Weighted Moving Average with BSI filtering logic.
It is designed to highlight directional momentum and provide stable buy and sell signals directly on the price chart.
The indicator displays a two-color signal line that switches between bullish and bearish phases.
A dark-blue line reflects upward trend conditions, while a pink line signals downward pressure.
Once a signal appears, it does not repaint, which makes it suitable for both manual execution and strategy testing.
Its adjustable settings include BSI calculation bars, fast and slow periods, tick volume usage, and the LWMA period.
These inputs allow traders to control sensitivity and adapt the indicator to different timeframes and currency pairs.
Free Download
bsi_trend_indicator_v1.1.mq5 Indicator (MT5)
Key Features
- Non-repainting two-color trend signal line.
- Dark-blue line for bullish phases.
- Pink line for bearish phases.
- Linear Weighted Moving Average core calculation.
- Optional tick volume integration.
- Customizable fast, slow, and LWMA periods.
Indicator Chart
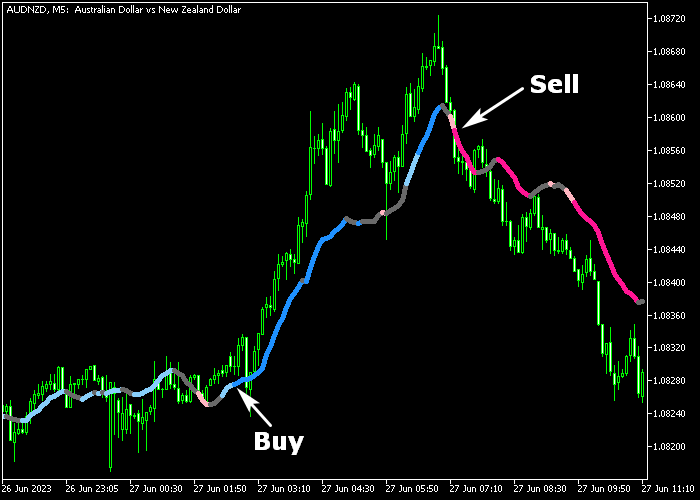
The BSI Trend Indicator Version 1.1 is plotted directly on the main price area as a color-changing signal line that follows market direction.
When the line turns dark-blue, it reflects emerging bullish momentum. When it shifts to pink, it signals a transition into bearish territory.
Each color change marks a potential trade opportunity.

Guide to Trade with the BSI Trend Indicator
Buy Rules
- Wait for the signal line to change from pink to dark-blue.
- Confirm the new dark-blue line is fully established on candle close.
- Open a buy trade at the start of the next candle.
- Prefer setups that align with higher timeframe bullish direction.
Sell Rules
- Wait for the signal line to change from dark-blue to pink.
- Confirm the new pink line is fully established on candle close.
- Open a sell trade at the start of the next candle.
- Prefer setups that align with higher timeframe bearish direction.
Stop Loss
- For buy trades, place the stop below the previous swing low.
- For sell trades, place the stop above the previous swing high.
Take Profit
- Close the buy trade when the signal line switches back to pink.
- Close the sell trade when the signal line switches back to dark blue.
- You may also secure partial profits at key price zones.
BSI Trend MT5 Scalping Strategy with Zone Trade Histogram Scalper
This scalping strategy combines the BSI Trend Indicator with the Zone Trade Histogram Scalper Indicator to create a simple yet effective approach on low timeframes.
The BSI Trend Indicator shows the current trend direction using colored lines, while the histogram bars from the Zone Trade Scalper highlight rapid shifts in momentum suitable for quick entries and exits.
Instead of chasing every price change, this method filters entries so that trades occur only when both trend direction and short-term momentum align.
It is ideal for scalpers who trade M1 and M5 charts during active market sessions such as London and New York.
Buy Entry Rules
- Confirm the BSI Trend Indicator line turns dark‑blue, indicating a bullish trend.
- Wait for the Zone Trade Histogram Scalper to print a blue bar, showing short‑term buy momentum.
- Enter a buy trade at the close of the signal candle.
- Place the stop loss below the nearest minor swing low.
- Close the trade when the histogram turns orange or the BSI Trend line starts to flatten or change to pink.
- You can also take partial profits at nearby short‑term resistance.
Sell Entry Rules
- Confirm the BSI Trend Indicator line turns pink, indicating a bearish trend.
- Wait for the Zone Trade Histogram Scalper to print an orange bar, showing short‑term sell momentum.
- Enter a sell trade at the close of the signal candle.
- Place the stop loss above the nearest minor swing high.
- Close the trade when the histogram turns blue or the BSI Trend line starts to flatten or flip to blue.
- You can also secure partial profits near nearby support.
Case Study 1: AUDUSD M1
On the AUDUSD M1 chart, the BSI Trend line turned dark‑blue after a brief consolidation, suggesting bullish pressure building in the very short term.
Shortly after this shift, the Zone Trade Histogram printed a blue bar.
A buy trade was taken at the close of the signal candle with the stop loss placed just below the recent low.
Price pushed upward quickly in small but steady increments, typical of short‑term moves on this pair.
The position was exited when the histogram flipped to orange, capturing a fast scalp gain.
Case Study 2: EURGBP M5
On the EURGBP M5 chart, the BSI Trend line turned pink, signaling a developing bearish trend on the short timeframe.
Soon after, an orange bar appeared on the Zone Trade Histogram, confirming immediate selling pressure.
A sell trade was entered at the close of the confirming candle with the stop loss placed above the recent swing high.
Price moved lower with small pullbacks, offering a clean scalping opportunity.
The trade was closed when a blue bar appeared, marking a quick reversal in momentum.
Download Now
bsi_trend_indicator_v1.1.mq5 Indicator (MT5)
FAQ
What is the benefit of using LWMA in this indicator?
The Linear Weighted Moving Average reacts faster to recent price changes compared to simple averages. This helps detect shifts in momentum earlier.
Should I enable tick volume?
Using tick volume can add extra confirmation during active sessions. Traders often test both settings on a demo account to determine which works best for their strategy.
Summary
The BSI Trend Indicator offers a straightforward way to follow market direction using a color-based signal line.
Its non-repainting behavior makes it dependable for structured trading decisions.
With flexible input settings and clear trend transitions, it adapts to multiple timeframes and strategies.
Traders can use it as a standalone trend guide or as a confirmation layer within a broader trading approach.


