
About the Tail Bar Indicator
The Tail Bar indicator for MT5 highlights bullish and bearish tail bar formations in a dedicated window below the main price area.
It focuses on rejection candles that often signal potential reversals or continuation moves.
A positive tail bar appears in sea-green and reflects strong rejection of lower prices.
A negative tail bar appears in magenta and signals rejection of higher prices.
These patterns help traders understand where buyers or sellers stepped in aggressively.
The indicator allows you to customize the tail bar up color and tail bar down color to match your chart template.
For best results, combine it with a reliable trend indicator so you only trade tail bars that align with the dominant market direction.
Used correctly, it improves entry timing and helps refine exits with price action precision.
Free Download
Key Features
- Displays bullish and bearish tail bars in a separate window.
- Sea-green bars indicate bullish rejection.
- Magenta bars indicate bearish rejection.
- Customizable colors for both bullish and bearish tail bars.
- Pairs effectively with trend-following indicators.
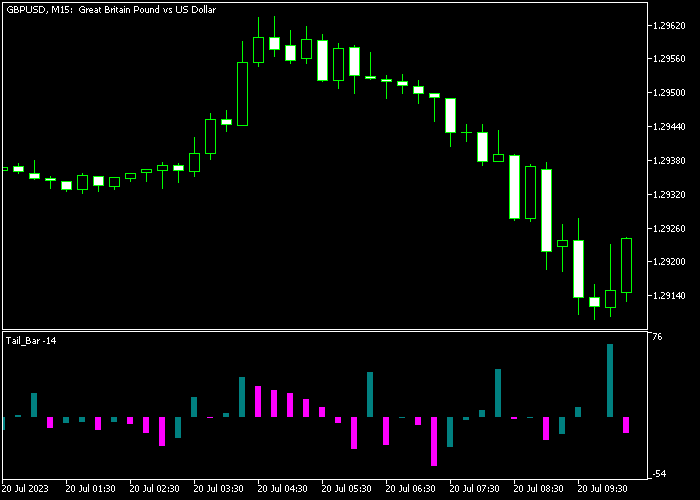
Indicator Chart
The Tail Bar indicator prints colored bars beneath the main price area to mark rejection candles.
Sea-green bars highlight bullish tail formations, while magenta bars identify bearish rejection patterns.
When aligned with the prevailing trend, these tail bars provide strong entry signals and help traders avoid counter-trend setups.
Guide to Trade with the Tail Bar Indicator
Buy Rules
- Confirm that the overall trend is bullish using a trend indicator.
- Wait for a sea-green positive tail bar to appear in the indicator window.
- Ensure the tail forms near support or during a pullback.
- Open a buy trade at the close of the confirmation candle.
Sell Rules
- Confirm that the overall trend is bearish using a trend indicator.
- Wait for a magenta negative tail bar to appear in the indicator window.
- Ensure the tail forms near resistance or during a retracement.
- Open a sell trade at the close of the confirmation candle.
Stop Loss
- For buy trades, place the stop loss below the low of the tail bar candle.
- For sell trades, place the stop loss above the high of the tail bar candle.
Take Profits
- Close buy trades if a magenta tail bar forms against your position.
- Close sell trades if a sea-green tail bar forms against your position.
- Alternatively, target a predefined risk-to-reward ratio such as 1:2.
- Advanced traders may trail profits behind new tail bar confirmations.
Tail Bar Indicator MT5 Scalping Strategy
This scalping strategy combines the Tail Bar Indicator for MT5 with the EMA Trend Catcher Forex Indicator for MT5 to create a fast and clean trading approach for M1 and M5 charts.
It focuses on aligning short-term price action signals with a clearly defined trend direction.
The EMA Trend Catcher indicates market direction with arrows and colored lines.
A blue arrow with a blue line confirms a bullish trend, while a red arrow with a red line confirms a bearish trend.
The Tail Bar Indicator provides precise entry signals.
A sea-green positive tail bar signals buying pressure, while a magenta negative tail bar signals selling pressure.
This combination allows traders to follow the trend and enter during short pullbacks.
It works best during volatile sessions where price moves with momentum and reacts cleanly to short-term signals.
Buy Entry Rules
- Wait for a blue arrow and blue line from the EMA Trend Catcher to confirm a bullish trend.
- Ensure price is moving consistently in the upward direction.
- Wait for a sea-green positive tail bar to appear as a buy signal.
- Enter a buy trade at the close of the signal candle.
- Place the stop loss a few pips below the recent swing low.
- Close the trade when a magenta tail bar appears or when a red arrow forms, or secure profits at a nearby resistance level.
Sell Entry Rules
- Wait for a red arrow and red line from the EMA Trend Catcher to confirm a bearish trend.
- Ensure price is moving consistently downward.
- Wait for a magenta negative tail bar to appear as a sell signal.
- Enter a sell trade at the close of the signal candle.
- Place the stop loss a few pips above the recent swing high.
- Close the trade when a sea-green tail bar appears or when a blue arrow forms, or secure profits at a nearby support level.
Case Study 1: Buy Trade on AUDUSD M1
The EMA Trend Catcher showed a blue arrow and a blue line, confirming a bullish trend.
Price continued to move upward with small pullbacks.
During one of these pullbacks, a sea-green tail bar appeared, signaling renewed buying pressure.
A buy trade was opened immediately after the candle closed.
The stop loss was placed just below the recent swing low.
Price quickly resumed its upward movement.
The trade was closed when a magenta tail bar appeared, signaling potential exhaustion.
The position captured a fast scalp aligned with the trend.
Case Study 2: Sell Trade on USDCHF M5
The EMA Trend Catcher displayed a red arrow and red line, confirming a bearish market.
Price remained below the trend structure and showed consistent downward movement.
A pullback formed, followed by a magenta tail bar indicating selling pressure returning.
A sell trade was opened after confirmation.
The stop loss was placed above the recent swing high.
Price continued downward in line with the trend.
The trade was closed when a sea-green tail bar appeared, signaling a possible reversal.
Download Now
FAQ
What makes a tail bar significant?
A tail bar becomes significant when the wick is noticeably longer than the candle body and shows strong rejection of a price level.
Which trend indicator works best with it?
You can combine it with moving averages, a trend filter, or a channel-based indicator.
The key is to trade tail bars only in the direction of the dominant trend.
Is it suitable for scalping?
Yes. On lower timeframes like M5 and M15, tail bars appear frequently. Focus on high-liquidity sessions and tight-spread pairs for better execution.
Summary
The Tail Bar indicator gives traders a focused way to identify price rejection patterns.
Its simple color-coded design makes it easy to spot bullish and bearish tails instantly.
When combined with a strong trend indicator, it becomes a powerful entry timing tool.
Traders who apply disciplined risk management and trade with the trend can use it to enhance precision and consistency.


