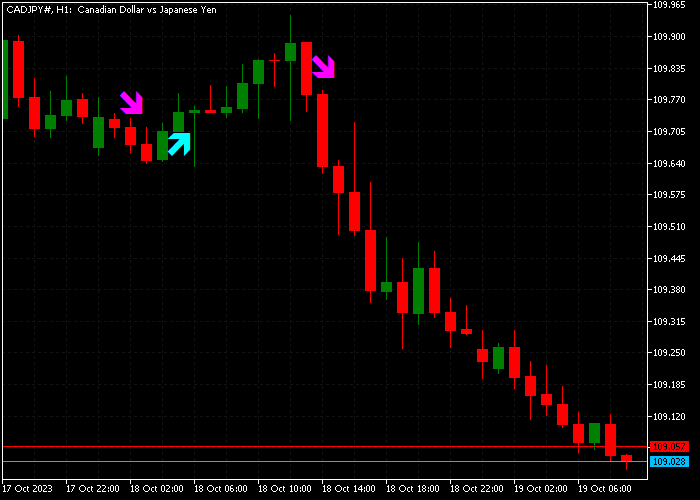
About the Extreme TMA Line Signal Indicator
The Extreme TMA Line Signal Indicator for MT5 combines the Triangular Moving Average (TMA) and Average True Range (ATR) to deliver reliable buy and sell signals.
It plots a dynamic signal channel directly on the price chart to help traders follow trends and detect potential reversals.
The indicator uses green and red lines to indicate market direction.
Green lines suggest bullish momentum, while red lines point to bearish conditions.
It is designed to be user-friendly for both beginners and experienced traders and works across multiple timeframes.
Traders can customize key parameters, including the TMA period, ATR period, ATR multiplier, trend threshold, and redraw settings.
Free Download
Extreme_TMA_line_indicator.mq5 Indicator (MT5)
Key Features
- Combines TMA and ATR for trend and volatility analysis.
- Plots green and red signal lines to indicate bullish or bearish trends.
- Easy-to-use interface for both beginners and experienced traders.
- Customizable TMA and ATR periods, multiplier, and trend threshold.
- Redraw option ensures signals update accurately with price action.
- Helps traders identify trend continuation and potential reversals.
Indicator Chart
The Extreme TMA Line Signal Indicator is displayed directly on the main price chart as a signal channel.
The green lines appear when upward momentum is building, and red lines show when downward pressure increases.
The gray channel lines act as guides for stop loss placement and trade exits, giving traders a clear visual framework for managing positions.

Guide to Trade with Extreme TMA Line Signal Indicator
Buy Rules
- Wait for the green TMA signal line to appear on the chart.
- Confirm that the trend is developing upward before opening a position.
- Open a buy trade once bullish conditions are confirmed.
Sell Rules
- Watch for the red TMA signal line to appear.
- Confirm that downward momentum is forming before opening a trade.
- Open a sell trade once bearish conditions are confirmed.
Stop Loss
- For buy trades, place the stop slightly below the lower gray channel line.
- For sell trades, place the stop slightly above the upper gray channel line.
Take Profit
- Close buy trades when the gray thick line appears or when the green line reverses to red.
- Close sell trades when the gray thick line appears or when the red line reverses to green.
- Traders can also trail stops along the TMA channel to capture extended trends.
MT5 Extreme TMA Line Indicator Scalping Strategy
This scalping strategy combines the Extreme TMA Line Indicator with the RSI Trend Scalper Indicator to trade efficiently during the Asian session.
The Asian session is known for slower and more controlled price movement, which makes it ideal for precise scalping setups.
Price often moves within ranges and reacts well to trend signals and short-term momentum shifts.
The Extreme TMA Line indicator defines the overall direction. A green TMA line shows a buy trend, while a red line shows a sell trend.
It helps filter out noise and keeps trades aligned with the prevailing direction.
The RSI Trend Scalper indicator provides entry timing.
A green line signals buying pressure, while a red line signals selling pressure.
This combination works well in calm market conditions where clean signals are easier to follow.
This strategy performs best on M1 and M5 charts using pairs such as USDJPY and AUDUSD, which are active and stable during the Asian session.
Buy Entry Rules
- Confirm the Extreme TMA Line is green, indicating a bullish trend.
- Wait for the RSI Trend Scalper line to turn green.
- Enter a buy trade at the close of the confirmation candle.
- Place a stop loss below the recent swing low or below the TMA line.
- Close the buy trade when the RSI line turns red or when the TMA line turns red.
Sell Entry Rules
- Confirm the Extreme TMA Line is red, indicating a bearish trend.
- Wait for the RSI Trend Scalper line to turn red.
- Enter a sell trade at the close of the confirmation candle.
- Set the stop loss above the recent swing high or above the TMA line.
- Close the sell trade when the RSI line turns green or when the TMA line turns green.
Case Study 1: USDJPY M5 Asian Session Buy Trade
On USDJPY M5 during the Asian session, price stayed above the Extreme TMA line, which remained green and confirmed a bullish trend.
The RSI Trend Scalper line turned green after a small pullback, indicating renewed buying pressure.
A buy trade was opened at the candle close.
The stop loss was placed below the recent swing low to manage risk within the tight range.
The long trade was closed when the RSI line turned red while price started to slow down near resistance.
This showed that bullish momentum had weakened and the bullish move was likely ending.
Case Study 2: AUDUSD M1 Asian Session Sell Trade
On AUDUSD M1, price moved below the Extreme TMA line, which turned red and confirmed a bearish trend.
The RSI Trend Scalper line turned red, signaling strong selling momentum.
A sell trade was opened at the close of the signal candle.
The stop loss was placed above the recent swing high to allow room for small fluctuations.
The short trade was closed when the RSI line turned green and price began to move upward.
This indicated that sellers were losing control and a reversal was developing.
Download Now
Extreme_TMA_line_indicator.mq5 Indicator (MT5)
FAQ
How does the Extreme TMA Line Signal indicator generate signals?
The indicator combines TMA to track the market trend and ATR to measure volatility.
Green lines indicate potential buy opportunities, red lines signal potential sell trades, and gray channel lines guide risk management and trade exits.
Can it be used with other indicators?
Yes. Many traders combine it with oscillators, support/resistance levels, or other trend indicators to confirm signals and improve accuracy.
Which timeframes are most effective?
The indicator works on all timeframes. High liquidity periods, like the London and New York sessions, often produce more reliable signals on shorter timeframes.
Summary
The Extreme TMA Line Signal Indicator provides a clear visual framework for tracking market trends and spotting trade opportunities.
Its combination of TMA and ATR allows traders to capture both trend direction and market volatility for precise entries and exits.
Customizable settings, intuitive signal lines, and built-in channel guidance make this indicator suitable for both beginner and experienced traders.