
About the MACD Divergence Indicator
The MACD Divergence Indicator for MT5 identifies divergence patterns between price and the MACD, helping traders anticipate trend reversals.
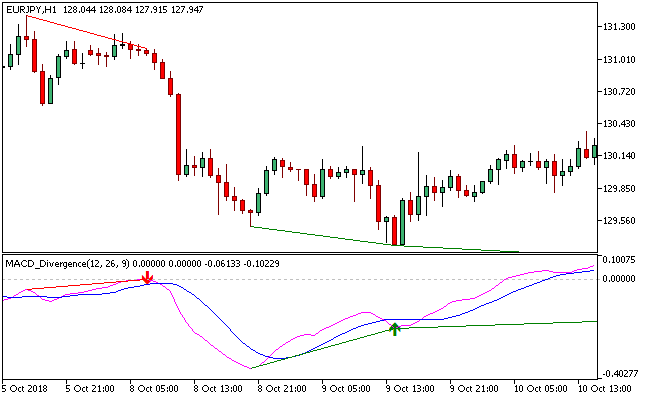
Bullish divergence is shown with green lines and arrows, while bearish divergence is displayed with red lines and arrows.
Solid lines indicate classic divergence, and dotted lines indicate reversed divergence.
With a built-in alert feature, the indicator notifies traders of potential trading opportunities in real-time.
It is versatile and can be applied to scalping, day trading, and swing trading.
Free Download
Key Features
- Detects bullish and bearish divergences using MACD.
- Green arrows and lines for bullish signals, red for bearish signals.
- Distinguishes classic divergence (solid lines) from reversed divergence (dotted lines).
- Built-in alert system for timely notifications.
Indicator Chart
The MACD Divergence Indicator plots divergence lines and arrows directly on the main chart.
Green arrows highlight potential buy opportunities, while red arrows highlight potential sell trades.
Traders can see classic divergences with solid lines and reversed divergences with dotted lines to improve entry and exit timing.
Guide to Trade with MACD Divergence Indicator
Buy Rules
- Open a buy trade when a green upward pointing arrow appears following a bullish divergence.
- Confirm price action supports a bullish trend.
- Check larger timeframe alignment if performing multi-timeframe analysis.
- Enter the trade once all conditions align.
Sell Rules
- Open a sell trade when a red downward pointing arrow appears following a bearish divergence.
- Confirm price action supports a bearish trend.
- Check larger timeframe alignment if performing multi-timeframe analysis.
- Enter the trade once all conditions align.
Stop Loss
- For buy trades, place the stop loss just below the low of the candlestick that triggered the green arrow.
- For sell trades, place the stop loss just above the high of the candlestick that triggered the red arrow.
- Optionally, add a small buffer to account for market noise and avoid premature exits.
Take Profit
- Close buy trades if a red downward arrow appears or momentum weakens.
- Close sell trades if a green upward arrow appears or momentum weakens.
- Consider trailing profits to follow extended moves in strong trends.
MT5 Divergence Scalping Strategy Using Simple MACD Arrows
This scalping strategy combines the MACD Divergence Indicator with the Zero Lag Hull Moving Average to trade momentum shifts that follow divergence signals on lower timeframes.
The MACD Divergence Indicator identifies structural disagreement between price action and momentum.
A green arrow signals bullish divergence where momentum starts strengthening after a downward move.
A red arrow signals bearish divergence where upward price movement loses strength.
The Zero Lag Hull Moving Average smooths price behavior while reacting quickly to direction changes.
A green line shows bullish trend conditions, while a violet line reflects bearish structure.
It helps confirm whether divergence signals align with the current trend environment rather than against it.
This strategy works best on M1 and M5 charts during London and New York sessions where volatility expands and divergence signals become more active.
Buy Entry Rules
- Wait for a green divergence arrow from the MACD Divergence Indicator after price forms a lower low.
- Confirm that the Zero Lag Hull Moving Average is green, indicating bullish trend alignment.
- Enter a buy trade at the close of the signal candle on M1 or M5 charts.
- Place the stop loss below the most recent swing low formed before the divergence signal.
- Close the trade when a red divergence arrow appears because it signals weakening bullish momentum.
- Alternative exit: close the trade when the Zero Lag Hull Moving Average turns violet, indicating bearish trend transition.
Sell Entry Rules
- Wait for a red divergence arrow from the MACD Divergence Indicator after price forms a higher high.
- Confirm that the Zero Lag Hull Moving Average is violet, indicating bearish trend alignment.
- Enter a sell trade at the close of the signal candle on M1 or M5 charts.
- Place the stop loss above the most recent swing high formed before the divergence signal.
- Close the trade when a green divergence arrow appears because it signals weakening bearish momentum.
- Alternative exit: close the trade when the Zero Lag Hull Moving Average turns green, indicating bullish trend transition.
Case Study 1
On EURUSD M5 during the London session, price pushed lower into a new swing low while the MACD Divergence Indicator printed a green arrow, signaling bullish divergence.
At the same time, the Zero Lag Hull Moving Average remained green.
A buy trade was opened at candle close.
The stop loss was placed below the divergence low where price previously reacted.
Later in the session, a red divergence arrow appeared after a minor rally.
The trade was closed because the MACD Divergence Indicator showed fading bullish momentum and no longer supported continuation.
Case Study 2
On GBPJPY M1 during the New York session, price formed a higher high while the MACD Divergence Indicator printed a red arrow, signaling bearish divergence.
The Zero Lag Hull Moving Average shifted to violet shortly after.
A sell trade was opened at the signal candle close.
The stop loss was placed above the divergence high where price previously failed.
20 minutes later, the Zero Lag Hull Moving Average turned green and the short trade was closed because the indicator confirmed a shift in overall market direction away from bearish conditions.
Download Now
FAQ
What makes the MACD Divergence Indicator different from standard MACD?
It highlights divergences between price and MACD with arrows and lines, providing early warning of potential trend reversals.
Can this indicator be used for scalping?
Yes. It works on lower timeframes for scalping while still being effective on higher timeframes for day trading or swing trading.
Does the indicator repaint?
No. Signals remain fixed once displayed, allowing traders to rely on the arrows for consistent trade decisions.
How should I use alerts effectively?
Use the built-in alert notifications to confirm trade setups and monitor larger timeframes for trend alignment before entering trades.
Summary
The MACD Divergence Indicator highlights key bullish and bearish divergences using colored arrows and lines to guide trade entries and exits.
Following its signals alongside carefully placed stop losses, take profit levels, and trend confirmation allows traders to make disciplined decisions and manage risk effectively.
Overall, it’s a great Forex indicator.


