About the Moving Averages Fan Indicator
The Moving Averages Fan indicator for MT5 helps traders identify trends and potential trade opportunities by displaying multiple fan lines on the main chart.
Each line represents a different moving average period, allowing you to visualize the market’s momentum and strength.
Green fan lines indicate the direction of the trend and act as dynamic support and resistance levels.
The indicator does not repaint, ensuring that signals remain reliable and consistent.
When the price stays above the fan, the market is considered bullish. When the price stays below, it signals a bearish trend.
Traders can customize the number of lines, colors, calculation methods, and start period to suit their trading strategy.
Free Download
Key Features
- Multiple moving averages displayed as fan lines for trend clarity.
- Signals the market trend based on candle position relative to fan lines.
- Customizable colors, periods, and calculation methods.
- Non-repainting for reliable historical and live signals.
- Acts as dynamic support and resistance zones for entries and exits.
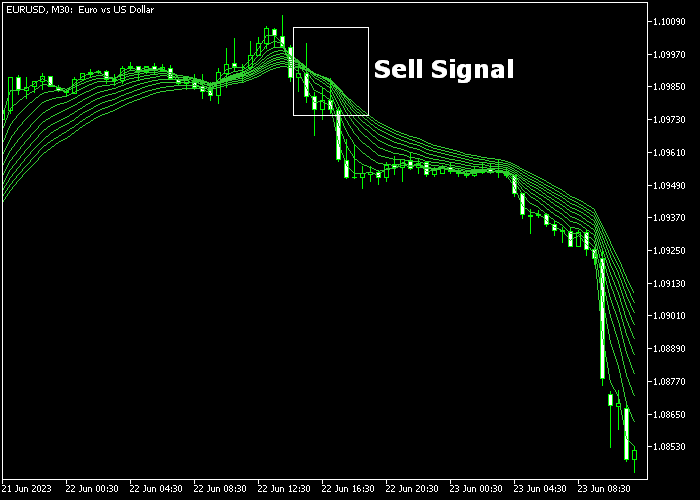
Indicator Chart
The Moving Averages Fan indicator appears on the main price area as colored fan lines.
The chart highlights bullish trends when candles stay above the fan and bearish trends when candles stay below.
Buy and sell signals are generated when candles cross the fan lines, giving traders clear entry points.

Guide to Trade with Moving Averages Fan Indicator
Buy Rules
- Open a buy trade when the candle crosses above the Moving Averages Fan from below.
- Confirm the trend by ensuring the price closes above multiple fan lines.
Sell Rules
- Open a sell trade when the candle crosses below the Moving Averages Fan from above.
- Confirm the downward trend by ensuring the price closes below multiple fan lines.
Stop Loss
- Place stop loss slightly beyond the nearest fan line for both buy and sell trades.
- Ensure stop levels do not exceed recent swing highs or lows.
- Move stop to break-even once the trade moves in your favor.
Take Profit
- Close the trade if the opposite signal from the fan lines appears.
- Alternatively, target key support or resistance zones based on the chart.
- Use trailing stops to lock in gains while staying in the trend.
Moving Averages Fan Breakout Strategy for MT5
This breakout strategy combines the Moving Averages Fan Indicator and the CCI Breakout Histogram Indicator to capture strong momentum moves when price escapes consolidation zones.
It focuses on identifying early breakout conditions and confirming them with momentum.
The Moving Averages Fan displays multiple moving averages spread across the price.
When price crosses above the fan, it signals a shift into a bullish trend. When price drops below the fan, it signals bearish pressure.
The CCI Breakout Histogram adds confirmation by showing momentum strength.
Histogram bars above zero indicate bullish momentum, while bars below zero indicate bearish pressure.
This strategy works best on M5, M15 and M30 timeframes.
It fits breakout traders who want to avoid false moves and focus only on strong, confirmed price expansions.
Buy Entry Rules
- Wait for price to cross above the Moving Averages Fan from below.
- Ensure the breakout candle closes clearly above the fan.
- Confirm that the CCI histogram prints a blue bar above the zero level.
- Enter a buy trade at the opening of the next candle.
- Place stop loss below the breakout level or recent consolidation low.
- Take profit when the histogram turns pink or when price shows rejection at resistance.
Sell Entry Rules
- Wait for price to cross below the Moving Averages Fan from above.
- Ensure the breakout candle closes clearly below the fan.
- Confirm that the CCI histogram prints a pink bar below the zero level.
- Enter a sell trade at the opening of the next candle.
- Place stop loss above the breakout level or recent consolidation high.
- Take profit when the histogram turns blue or when price reacts near support.
Case Study 1: Bullish Breakout Expansion
On EURAUD M15, price moved in a tight range before a strong breakout occurred.
A candle closed above the Moving Averages Fan, showing a clear bullish shift.
At the same time, the CCI Breakout Histogram printed a strong blue bar above zero, confirming momentum.
A buy trade was entered at the next candle. The stop loss was placed below the consolidation zone.
Price expanded rapidly as volatility increased.
The trade was closed for 52 pips profit when the histogram began to weaken and shifted color, securing profits from the breakout move.
Case Study 2: Bearish Breakout Continuation
On NZDUSD M30, price consolidated before breaking downward.
A candle closed below the Moving Averages Fan, signaling a bearish breakout.
The CCI histogram confirmed the move with a pink bar below zero, indicating strong selling momentum.
A sell trade was opened after the breakout candle. The stop loss was placed above the recent range high.
Price continued falling with strong bearish candles.
Unfortunately, the trade was closed for a 12 pip loss when the histogram flipped back above zero, capturing a clean breakout continuation.
Download Now
FAQ
How many fan lines can I use?
You can customize the number of fan lines. Adding more lines allows finer trend analysis, while fewer lines simplify trend visibility for quicker decisions.
What settings should I adjust for volatility?
Adjust the moving average periods, type, and calculation method to match the market’s volatility. Shorter periods react faster, longer periods smooth out price fluctuations.
Is this indicator suitable for all timeframes?
Yes, it works on all timeframes. Traders can use it for intraday scalping or long-term trend trading. Testing on your preferred timeframe ensures optimal signal reliability.
Summary
The Moving Averages Fan indicator provides a clear view of market trends and potential trade opportunities.
Its customizable fan lines act as dynamic support and resistance, helping traders make informed decisions.
Non-repainting signals make backtesting and live trading more reliable.
Overall, it’s a practical tool for both new and experienced traders seeking to trade trends confidently.


