
About the Trade Entry Forex Levels Indicator
The Trade Entry Forex Levels Indicator for MT5 automatically calculates structured entry zones and projected take profit levels for both long and short trades.
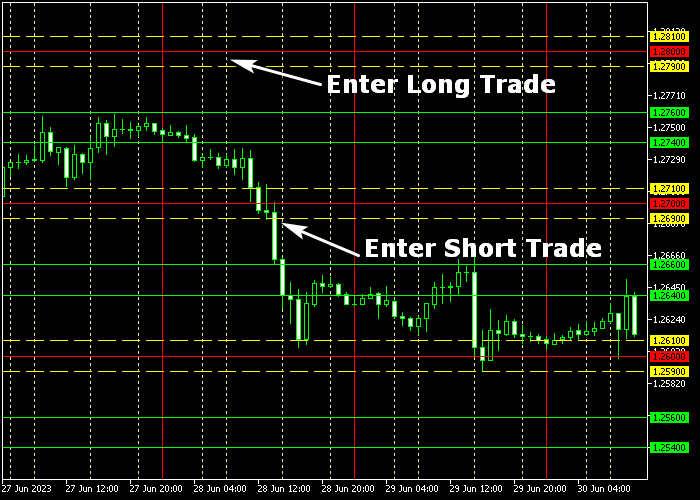
It is plotted directly on the main price chart using horizontal and vertical lines.
The yellow dashed horizontal lines define potential entry areas.
The solid green horizontal lines highlight projected profit targets.
Red vertical lines mark the most favorable trading hours during the day.
This layout gives traders a complete intraday framework without manual calculations.
Instead of guessing entries and exits, the levels are pre-defined and visually clear on the chart.
Settings such as colors and line styles can be customized to match your chart template and trading preferences.
Free Download
Key Features
- Automatically calculated buy and sell entry zones.
- Predefined take profit target levels.
- Session timing guidance through vertical red lines.
- Displayed directly on the main price chart.
- Customizable colors and line styles.
- Suitable for structured intraday trading.
Indicator Chart
The Trade Entry Forex Levels Indicator overlays yellow dashed entry lines and green take profit lines directly on the price chart.
The upper and lower yellow zones define potential trade activation areas. The green horizontal levels show projected profit targets.
Red vertical lines indicate high-activity trading hours to help traders focus on strong market sessions.
Guide to Trade with Trade Entry Forex Levels Indicator
Buy Rules
- Wait for the price to trade between the two upper yellow dashed lines.
- Confirm that the setup forms during the highlighted trading hours.
- Enter a buy position while price remains within the defined zone.
- Avoid buying if volatility is extremely low.
Sell Rules
- Wait for the price to trade between the two lower yellow dashed lines.
- Confirm that the opportunity appears during the marked session window.
- Open a sell position within the predefined entry zone.
- Avoid selling against strong directional momentum.
Stop Loss
- For buy trades, place the stop loss slightly below the nearest green horizontal level.
- For sell trades, place the stop loss slightly above the nearest green horizontal level.
- Alternatively, position the stop beyond the opposite yellow entry boundary.
- Keep the risk per trade aligned with your money management plan.
Take Profit
- For buy trades, close the position when price reaches the upper green solid lines.
- For sell trades, close the position when price reaches the lower green solid lines.
- Secure partial profits if price hesitates near the target area.
- Exit early if price fails to hold within the intended direction.
Trade Entry Levels and Triangular Moving Average MT5 Intraday Strategy
This intraday Forex strategy blends dynamic entry zones with trend confirmation to identify clean trading opportunities.
It uses the Trade Entry Levels Indicator to define potential buy and sell areas based on key price zones and the Triangular Moving Average Indicator to confirm the prevailing trend and direction.
This combination helps traders enter early in intraday moves while maintaining trend alignment.
The Trade Entry Levels indicator plots dashed yellow lines above and below price for buy and sell entry.
The Triangular Moving Average shows trend direction through its colored lines.
A medium sea green line reflects bullish bias and supports long setups, while a deep pink line signals bearish bias and supports short setups.
Aligning entries with trend direction helps filter noise and improves trade quality.
Buy Entry Rules
- Confirm that the Triangular Moving Average line is medium sea green, indicating a bullish trend bias.
- Wait for price to trade between the two upper dashed yellow lines, signaling a possible buy area.
- Enter a buy trade at the next candle open once both conditions are met.
- Place the stop loss below the lower yellow dashed line or just under recent swing low.
- Take profit when price shows a clear loss of upward momentum or after capturing your target pips, or exit early if the TMA line turns deep pink.
Sell Entry Rules
- Confirm that the Triangular Moving Average line is deep pink, indicating bearish trend bias.
- Wait for price to trade between the two lower dashed yellow lines, signaling a possible sell area.
- Enter a sell trade at the next candle open once both conditions align.
- Place the stop loss above the upper yellow dashed line or just above recent swing high.
- Take profit when price loses downward momentum or after realizing your target pips, or exit early if the TMA line turns medium sea green.
Case Study 1: EUR/USD M15 Zone Entry
During a London session on the M15 timeframe, EUR/USD was trending upward with the TMA line medium sea green.
Price approached the upper yellow zone and began trading between the two upper dashed lines.
A buy trade was entered at the next candle open once both conditions were met.
Instead of holding to a resistance level, the trade was closed after a measured momentum surge gave a 23‑pip gain, and the TMA color started to flatten, indicating diminishing strength.
Case Study 2: GBP/USD M30 Pullback Sell
On the M30 chart in the New York session, GBP/USD showed a bearish bias with the TMA line deep pink.
After a retracement higher, price dipped into the lower dashed yellow zone.
A sell trade was taken at the next candle open after the entry zone was confirmed.
The position was closed once a quick retracement occurred and price lost downward traction, locking in a 47‑pip move without waiting for major support.
Download Now
FAQ
What do the red vertical lines represent?
The red vertical lines highlight the most active trading hours of the day.
These periods often provide stronger price movement and better follow-through.
Are the entry levels recalculated daily?
Yes. The indicator automatically updates its levels based on recent market data to reflect current trading conditions.
Can I change the appearance of the lines?
Yes. Colors, line styles, and other visual settings can be adjusted to match your chart layout.
Summary
The Trade Entry Forex Levels Indicator delivers a rule-based framework by defining entry zones, profit targets, and optimal trading hours.
Its visual layout removes guesswork and helps traders focus on predefined price areas.
The automatic calculation of levels saves time and keeps execution consistent.
This tool fits traders who prefer structured setups and session-based opportunities rather than discretionary entries.


