
About the Triangular Moving Average Indicator
The Triangular Moving Average Indicator for MT5 is a weighted moving average that emphasizes the central values of price data for smoother results.
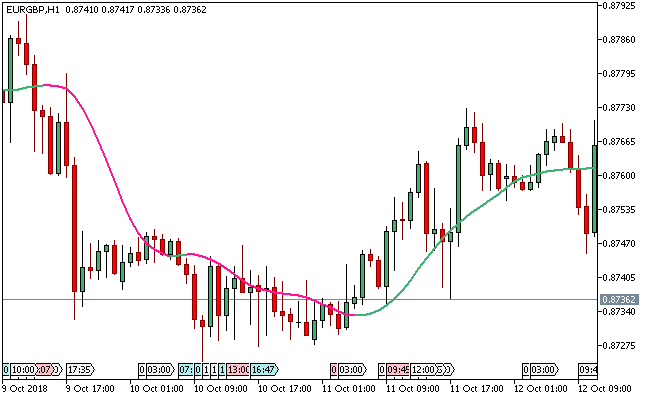
Displayed as a line on the main chart, it changes color according to market direction, with medium sea green indicating bullish trends and deep pink showing bearish trends.
This moving average type is known for its accuracy and speed.
Traders can use it to identify entry and exit points for all trading styles, including scalping, day trading, and swing trading.
Non-repainting signals ensure that the line reflects real-time trend changes without misleading adjustments.
Free Download
Triangular moving average.ex5 (MT5)
Key Features
- Weighted moving average emphasizing central price values.
- Line changes color: medium sea green for bullish trends, deep pink for bearish trends.
- Non-repainting for reliable trading signals.
- Suitable for scalping, day trading, and swing trading.
- Fast calculation with smooth trend visualization.
- Helps traders identify accurate entries and exits.
Indicator Chart
The Triangular Moving Average Indicator plots a line on the main chart. Medium sea green segments indicate bullish conditions and potential buy signals.
Deep pink segments indicate bearish conditions and potential sell signals.
Guide to Trade with Triangular Moving Average Indicator
Buy Rules
- Open a buy trade when the line turns medium sea green and slopes upward.
- Confirm the overall price trend supports a bullish move.
- Check for alignment with other trend indicators if needed.
Sell Rules
- Open a sell trade when the line turns deep pink and slopes downward.
- Confirm the overall price trend supports a bearish move.
- Check for alignment with other trend indicators if needed.
Stop Loss
- Place stop losses slightly below the Triangular Moving Average line for buy trades.
- Place stop losses slightly above the Triangular Moving Average line for sell trades.
- This method protects the trade while avoiding premature stop-outs.
Take Profit
- Close buy trades if the line turns deep pink or trend momentum weakens.
- Close sell trades if the line turns medium sea green or momentum weakens.
- Consider trailing profits to capture strong trend moves.
MT5 Day Trading Strategy Using Triangular MA for Beginner Traders
This strategy combines the Triangular Moving Average Indicator with the QQE of Velocity MTF Indicator to create a simple trend-following system suitable for beginners.
The Triangular Moving Average is a smoothed trend filter that reduces market noise and highlights the main direction of price.
A medium sea green line signals bullish momentum, while a deep pink line signals bearish pressure.
It helps traders stay aligned with the dominant market direction instead of reacting to short-term fluctuations.
The QQE of Velocity MTF Indicator confirms timing by measuring momentum strength.
A blue line signals a valid buy condition, while a brown line signals sell pressure.
This gives a clear trigger for entries once trend direction is already established.
This approach focuses on clean trend continuation setups rather than reversals, making it easier for beginners to follow structured entries.
Buy Entry Rules
- Confirm that the Triangular Moving Average line is medium sea green, showing a bullish market trend.
- Wait for the QQE of Velocity MTF Indicator to turn blue, confirming buy momentum.
- Enter a buy trade at the close of the signal candle on EURUSD, GBPUSD, or AUDUSD during active sessions.
- Place the stop loss below the most recent swing low or below the triangular moving average line if it is closer.
- Close the trade when the QQE of Velocity MTF Indicator turns brown because it signals momentum loss in the bullish direction.
- Alternative exit: close the trade when the Triangular Moving Average turns deep pink because it confirms a bearish trend shift.
Sell Entry Rules
- Confirm that the Triangular Moving Average line is deep pink, showing a bearish market trend.
- Wait for the QQE of Velocity MTF Indicator to turn brown, confirming sell momentum.
- Enter a sell trade at the close of the signal candle on pairs like EURUSD, USDJPY, or GBPUSD.
- Place the stop loss above the most recent swing high or above the triangular moving average line if it is closer.
- Close the trade when the QQE of Velocity MTF Indicator turns blue because it signals bullish momentum returning.
- Alternative exit: close the trade when the Triangular Moving Average turns medium sea green because it confirms a bullish trend reversal.
Case Study 1
On EURUSD H1, the Triangular Moving Average turned medium sea green after a steady upward movement.
Price then paused briefly in a narrow consolidation.
The QQE of Velocity MTF Indicator switched to blue, confirming bullish momentum.
A buy trade was opened at candle close.
The stop loss was placed below the recent swing low formed during consolidation.
One day later, the QQE of Velocity MTF Indicator turned brown.
The trade was closed because momentum shifted away from bullish conditions.
Case Study 2
On GBPJPY M15, the Triangular Moving Average turned deep pink after a strong downward move.
Price retraced slightly but failed to break the bearish structure.
The QQE of Velocity MTF Indicator turned brown, confirming continued bearish pressure.
A sell trade was opened at candle close.
The stop loss was placed above the last intraday rejection high.
Later that day, the Triangular Moving Average shifted from deep pink to medium sea green.
The trade was closed because the indicator confirmed a change in overall trend direction.
Download Now
Triangular moving average.ex5 (MT5)
FAQ
How does the Triangular Moving Average work?
It is a weighted moving average that emphasizes central price values and changes color to indicate bullish or bearish trends.
Is the indicator suitable for all trading styles?
Yes. It works well for scalping, intraday, and swing trading on any currency pair.
Does the Triangular Moving Average repaint?
No. The line is fixed once plotted, ensuring accurate trend signals.
Can it be used alongside other indicators?
Yes. It can complement momentum, trend, or support/resistance indicators to improve trade timing and decision-making.
Summary
The Triangular Moving Average Indicator delivers a smooth and responsive trend line that highlights market direction without lag.
Medium sea green signals indicate bullish conditions and potential buy entries while deep pink signals bearish conditions and potential sell entries.
It works effectively across all timeframes and currency pairs for scalping, intraday, and swing trading.
Following the color signals with well-considered stop losses, take profit levels, and trend confirmation helps traders make disciplined and confident trading decisions.


