About the XO Point and Figure Indicator
The XO Point and Figure indicator for MT5 is a specialized technical tool that filters market noise by removing the element of time from price charts.
It focuses exclusively on significant price movements, creating a chart that only updates when a specific price distance is covered.
This approach allows traders to ignore sideways consolidation and minor fluctuations that often lead to false signals in time-based charts.
By highlighting only the pure upward and downward shifts, it provides a unique perspective on the true supply and demand balance within the market.
This makes it an excellent tool for long-term trend following and for identifying high-probability breakout zones.
Free Download
Key Features
- The indicator removes the time element to focus solely on significant price changes.
- Green and red colored candles provide a clear visual representation of bullish and bearish trends.
- The price step setting allows traders to define the minimum movement required to plot a new bar.
- A directional threshold parameter determines how much the price must reverse to signal a trend change.
- Verification settings allow for adjusting the number of bars used to confirm signal accuracy.
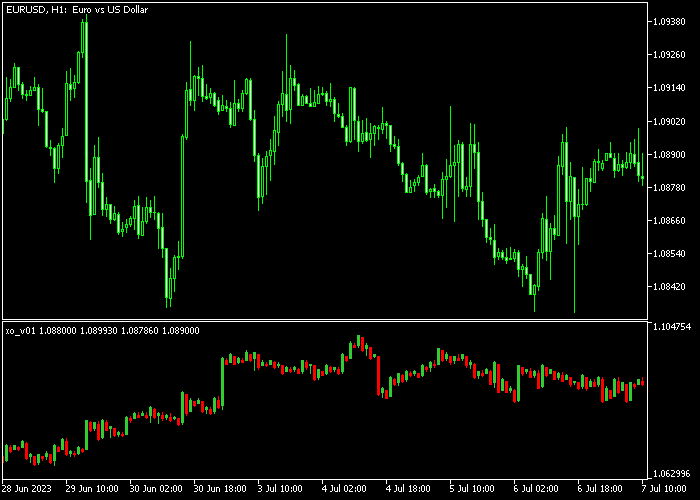
Indicator Chart
The chart shows the XO Point and Figure indicator generating a series of vertical trend bars in a dedicated sub-window.
The green candles represent clear upward price momentum, while the red candles mark sustained downward moves.

Guide to Trade with the XO Point and Figure indicator
Buy Rules
- Monitor the sub-window for the appearance of the first green colored Point and Figure candle.
- Ensure the price has moved above a major horizontal resistance level on the main chart.
- Initiate a buy market order once the bullish reversal is confirmed by the price step calculation.
- Maintain the long position as long as the indicator continues to print consecutive green candles.
Sell Rules
- Enter a sell transaction when the indicator displays the first red colored Point and Figure candle.
- Verify that the bearish shift is supported by a breakdown of a significant support zone.
- Execute the trade only after the price has crossed the threshold required for a directional change.
- Keep the short trade active while the indicator remains bearish without showing a reversal bar.
Stop Loss
- Place a protective stop loss below the most recent swing low point on the main price chart.
- Set your defensive stop loss above the previous swing high region for all sell orders.
- The previous column’s low or high in the Point and Figure window can serve as a target.
- Adjust the stop to break-even once the trend has moved at least two price steps in your favor.
Take Profit
- Exit the buy trade when the indicator produces its first red colored bearish reversal candle.
- For sell positions, close the trade immediately when a green colored bullish candle appears.
- Targeting a fixed profit based on a multiple of your price step setting is a professional exit.
- Manual exits are advisable at major structural levels identified on higher timeframes.
XO Point and Figure Scalping MT5 Strategy
This scalping strategy focuses on capturing short-term price movements using the XO Point and Figure Indicator combined with the Zero Lag RSI Indicator.
It is ideal for active traders looking for quick entries during volatile market sessions such as London and New York.
The XO Point and Figure Indicator highlights potential buy and sell opportunities with colored candles.
A green candle signals a bullish setup, while a red candle indicates bearish conditions.
The Zero Lag RSI confirms trend strength and momentum with its histogram, showing green for bullish trends and red for bearish trends.
This combination ensures trades are taken in the direction of momentum while avoiding sideways market noise.
This approach works best on M1 and M5 timeframes, allowing traders to capitalize on short-term price swings with precise entry and exit points.
Buy Entry Rules
- Wait for a green candle on the XO Point and Figure Indicator.
- Confirm that the Zero Lag RSI histogram is green.
- Enter a buy trade at the close of the green candle.
- Place the stop loss below the recent short-term swing low.
- Close the trade when a red candle appears or when the Zero Lag RSI histogram turns red.
Sell Entry Rules
- Wait for a red candle on the XO Point and Figure Indicator.
- Confirm that the Zero Lag RSI histogram is red.
- Enter a sell trade at the close of the red candle.
- Place the stop loss above the recent short-term swing high.
- Close the trade when a green candle appears or when the Zero Lag RSI histogram turns green.
Case Study 1: EURUSD M1 Buy Scalping Setup
During the London session on EURUSD M1, a green candle appeared on the XO Point and Figure Indicator, signaling a potential bullish move.
The Zero Lag RSI histogram was green, confirming momentum was in favor of buyers.
A buy trade was entered at the close of the green candle.
The stop loss was set below the recent short-term low.
Price quickly moved upward following the bullish signal.
The trade was closed when a red candle appeared on the XO Point and Figure Indicator and the Zero Lag RSI histogram turned red, capturing a fast scalp in line with momentum.
Case Study 2: GBPUSD M5 Sell Scalping Setup
On GBPUSD M5 during the New York session, a red candle formed on the XO Point and Figure Indicator, indicating a bearish setup.
The Zero Lag RSI histogram was red, confirming downward momentum.
A sell trade was opened at the close of the red candle.
The stop loss was placed above the recent short-term swing high.
Price moved downward rapidly as the trend continued.
The position was closed when a green candle appeared and the Zero Lag RSI histogram turned green, exiting in alignment with the momentum shift for a quick scalp.
Download Now
FAQ
Why does the indicator not move for long periods?
The XO Point and Figure indicator only plots new data when the price moves by a specific amount.
If the market is ranging or volatility is low, the chart will remain unchanged until a breakout occurs.
What does the “price step” parameter control?
The price step defines the size of each box or candle.
A larger price step filters out more noise for long-term trading, while a smaller step makes the indicator more sensitive for intraday moves.
Is it better to use this with other indicators?
Yes, combining this tool with volume indicators or the EMA Zero-Lag moving average is highly recommended.
Since it ignores time, a secondary tool can help you gauge the strength of the breakout before entering.
Summary
The XO Point and Figure indicator for Metatrader 5 is a popular trend analysis tool offering reliable signals for buying and selling pairs in the Forex market.
It provides a unique way to view market structure by eliminating the distractions of time and minor volatility.
The ability to customize the price step and reversal thresholds makes it adaptable to any asset.
Overall, it is a robust tool for those seeking a simplified and objective perspective on price trends.


