About the ZigZag Fibo indicator
The ZigZag Fibo indicator for MT5 is a technical tool that automates the process of identifying market swings and plotting Fibonacci retracement levels.
Once a high and low are established, the indicator automatically draws Fibonacci levels across the move to pinpoint potential areas of trend continuation.
This helps traders focus on high-probability zones where the market is likely to resume its primary direction after a temporary correction.
Traders primarily use this tool to find optimal entry points during pullbacks in trending markets.
The indicator focuses on the 38.2% retracement level as a key area of interest, which often serves as a springboard for the next leg of a trend.
Free Download
zigzag_nk_fibo.mq5 Indicator (MT5)
Key Features
- The indicator automatically identifies significant market swings using ZigZag logic.
- Fibonacci retracement levels are plotted instantly between the most recent price peaks and troughs.
- The 38.2% level is highlighted as a primary zone for identifying trend-following trade entries.
- Visual styles and Fibonacci colors can be modified to match any chart background.
Indicator Chart
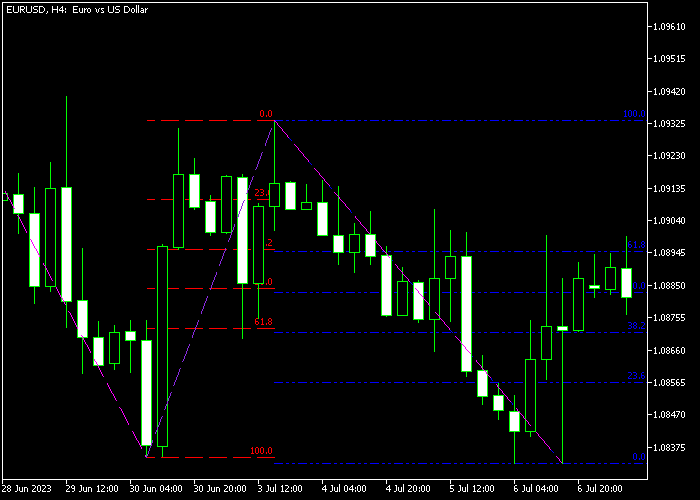
The chart shows the ZigZag Fibo indicator mapping out price swings with straight lines and horizontal Fibonacci levels.
You can see how the indicator identifies a major move and provides the specific retracement zones where price is likely to find support or resistance.

Guide to Trade with ZigZag Fibo indicator
Buy Rules
- Confirm that the currency market is in a sustained uptrend by observing higher highs and lows.
- Wait for the price to undergo a pullback toward the 38.2% Fibonacci retracement level.
- Initiate a buy trade once price action shows signs of rejection or stabilization at this level.
- Ensure the ZigZag leg has firmly established a local bottom before committing to the entry.
Sell Rules
- Ensure the overall market direction is trending down with a series of lower peaks.
- Wait for a price rally or relief move back toward the 38.2% Fibonacci retracement level.
- Open a sell trade when the price hits the 38.2% zone and displays bearish momentum.
- Verify that the most recent ZigZag high is locked in to validate the current retracement grid.
Stop Loss
- Place a protective stop loss order below the most recent swing support level for buy trades.
- Set a defensive stop loss above the most recent swing resistance level for all sell orders.
- The 50% or 61.8% Fibonacci levels can also serve as logical points for stop placement.
- Adjust your stop to break-even once the price has moved significantly away from the entry zone.
Take Profit
- Exit the trade when the price reaches a reward to risk ratio of at least 2.5.
- Target the previous ZigZag high for buy trades or the previous ZigZag low for sell trades.
- Manual exits are recommended if a new ZigZag signal forms against your current trade direction.
ZigZag Fibo Fibonacci Reversal MT5 Strategy
This strategy focuses on trading pullbacks within strong trends using the ZigZag Fibo Forex Indicator and the Elder Impulse System Indicator.
The ZigZag Fibo automatically identifies swing highs and lows and plots Fibonacci retracement levels, helping traders spot precise pullback zones like the 38.2% level.
This allows you to enter trades at better prices within the trend instead of entering too late.
The Elder Impulse System confirms momentum and direction.
A green histogram shows bullish strength, while a red histogram signals bearish pressure.
This indicator combines trend and momentum to highlight when price is accelerating in a direction, making it a strong confirmation tool.
This strategy works best on M15, M30, and H1 timeframes.
It suits traders who want structured entries using Fibonacci levels with clear confirmation from momentum.
Buy Entry Rules
- Wait for a clear uptrend structure using the ZigZag Fibo.
- Watch for price to pull back toward the 38.2% Fibonacci retracement level.
- Confirm that the Elder Impulse System histogram is green.
- Enter a buy trade when price reacts and closes bullish from the 38.2% zone.
- Place the stop loss below the recent swing low.
- Close the trade when the histogram turns red.
Sell Entry Rules
- Wait for a clear downtrend structure using the ZigZag Fibo.
- Watch for price to rally back toward the 38.2% Fibonacci retracement level.
- Confirm that the Elder Impulse System histogram is red.
- Enter a sell trade when price reacts and closes bearish from the 38.2% zone.
- Place the stop loss above the recent swing high.
- Close the trade when the histogram turns green.
Case Study 1: EURUSD M15 Buy Pullback
On EURUSD M15, price formed a clear uptrend with higher highs and higher lows.
The ZigZag Fibo plotted a retracement after a strong bullish move, and price pulled back toward the 38.2% level.
At that level, price showed rejection and began to move upward again.
The Elder Impulse System histogram remained green, confirming that bullish momentum was still active.
A buy trade was entered at candle close after confirmation.
The stop loss was placed below the recent swing low. Price then continued upward following the trend.
The trade was closed for a tiny profit when the histogram turned red, signaling that bullish momentum had weakened and the move was likely ending.
Case Study 2: GBPJPY H1 Sell Pullback
On GBPJPY H1, the market was in a clear downtrend with consistent lower highs.
After a strong bearish move, price retraced upward toward the 38.2% Fibonacci level plotted by the ZigZag Fibo.
At this level, price began to stall and showed signs of rejection.
The Elder Impulse System histogram was red, confirming that bearish momentum remained dominant.
A sell trade was entered at the close of the rejection candle.
The stop loss was placed above the recent swing high. Price then moved lower as the trend resumed.
The position was closed for 83 pips profit when the histogram turned green, indicating that bearish momentum had faded and a potential reversal could follow.
Download Now
zigzag_nk_fibo.mq5 Indicator (MT5)
FAQ
Why is the 38.2% level considered the most interesting?
The 38.2% level is a shallow retracement often found in very strong trends.
Entering here allows traders to join a fast-moving market at a better price without waiting for a deep correction that might never come.
Does the ZigZag leg move after it is drawn?
The final leg of a ZigZag indicator can change as new price highs or lows are formed.
Traders should wait for price action to react to the Fibonacci levels rather than entering purely because a line is present.
Can I use this indicator for scalping?
Yes, it works effectively on the M1 and M5 timeframes.
When scalping, it is crucial to focus on the 38.2% level during the London and New York sessions to ensure there is enough volatility to reach your targets.
Summary
The ZigZag Fibo indicator is a popular trend analysis tool offering reliable signals for buying and selling pairs in the Forex market.
It combines the structural clarity of ZigZag swings with the mathematical precision of Fibonacci retracements to find high-quality entries.
While it is effective as a standalone tool, it performs best when aligned with the dominant market trend.
Overall, it is a versatile and essential tool for traders who utilize market geometry in their daily routines.


