
About the Trend Signals V2 Indicator
The Trend Signals V2 indicator for MT5 is designed for traders who want to follow momentum with precision.
The indicator prints colored trend lines directly on the price window to signal bullish or bearish pressure.
A blue line represents buying strength and signals potential long opportunities.
A red line represents selling pressure and signals potential short setups.
The algorithm focuses on sustained moves instead of minor fluctuations, which helps traders avoid weak entries.
It performs strongly during the London and New York sessions when volatility increases.
The tool supports fast decision-making and keeps execution aligned with the dominant trend.
Free Download
Key Features
- Real-time buy and sell signals based on trend momentum.
- Blue line for bullish conditions and red line for bearish conditions.
- Optimized for trending market environments.
- Customizable line colors, styles, and calculation periods.
- Works efficiently on lower timeframes such as M1 and M5.
- Supports disciplined intraday trading decisions.
Indicator Chart
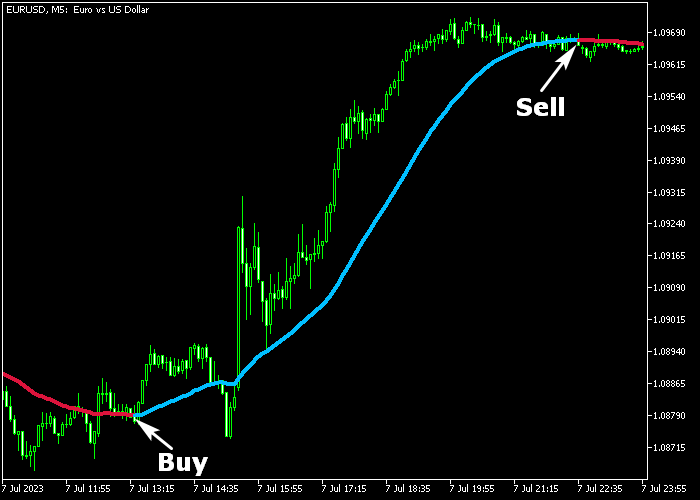
The Trend Signals V2 indicator is plotted directly on the main price window and follows market direction with colored signal lines.
When the blue line appears, it indicates strengthening bullish momentum and potential buy entries.
When the red line prints, it reflects increasing bearish pressure and potential sell opportunities.
The shift between blue and red helps traders stay aligned with trend continuation.
Guide to Trade with Trend Signals V2 Indicator
Buy Rules
- Wait for the blue Trend Signals V2 line to appear on the price window.
- Confirm that price is trading above a recent support level.
- Enter a buy trade at the close of the signal candle.
- Trade during high-volume sessions for stronger follow-through.
Sell Rules
- Wait for the red Trend Signals V2 line to print on the price window.
- Confirm that price is trading below a recent resistance level.
- Open a sell trade at the close of the signal candle.
- Avoid entering during slow or ranging conditions.
Stop Loss
- Place the stop loss below the recent swing low for buy trades.
- Place the stop loss above the recent swing high for sell trades.
- Adjust stop distance according to current volatility.
Take Profit
- Close the full buy position when the red signal line appears.
- Close the full sell position when the blue signal line appears.
- You may also secure profits near key support or resistance zones.
Trend Signals V2 Forex Indicator Reversal MT5 Strategy
This strategy combines two reliable tools to capture clean reversals and strong trend continuation moves.
It uses the Trend Signals V2 Forex Indicator together with the ADX Trend Reversal Alert Indicator.
The idea is simple. You wait for a clear shift in trend direction and confirm it with a precise entry signal.
This approach works best on M15, M30, and H1 timeframes.
It fits traders who want structured rules and clear confirmation before entering a trade.
The Trend Signals V2 defines the market direction with its color changes, while the ADX Trend Reversal Alert highlights the exact moment to enter.
By combining trend direction with reversal timing, this strategy filters out weak setups and keeps you focused on stronger opportunities.
You only take trades when both indicators align.
Buy Entry Rules
- Wait for the Trend Signals V2 line to turn blue, confirming an uptrend.
- Look for a green arrow from the ADX Trend Reversal Alert Indicator.
- Enter a buy trade at the close of the signal candle.
- Place the stop loss below the most recent swing low or slightly below the blue line.
- Close the trade when the Trend Signals V2 line turns red or when a purple arrow appears.
Sell Entry Rules
- Wait for the Trend Signals V2 line to turn red, confirming a downtrend.
- Look for a purple arrow from the ADX Trend Reversal Alert Indicator.
- Enter a sell trade at the close of the signal candle.
- Place the stop loss above the most recent swing high or slightly above the red line.
- Close the trade when the Trend Signals V2 line turns blue or when a green arrow appears.
Case Study 1: EURUSD M30 Buy Reversal
On the EURUSD pair using the M30 timeframe, price had been moving in a steady downtrend with the Trend Signals V2 line showing red.
The market began to slow down and form a base, suggesting selling pressure was fading.
The Trend Signals V2 line shifted from red to blue, indicating a potential change in direction.
Shortly after, a green arrow appeared from the ADX Trend Reversal Alert Indicator.
This provided a clear confirmation that buyers were stepping in.
A buy trade was entered at the close of the signal candle.
The stop loss was placed below the recent swing low.
Price then moved upward with increasing momentum.
The position was later closed for 31 pips when an opposite signal appeared.
Case Study 2: GBPJPY H1 Sell Reversal
On the GBPJPY pair using the H1 timeframe, price had been trending upward with the Trend Signals V2 line showing blue.
As price approached a resistance area, momentum started to weaken.
The Trend Signals V2 line turned from blue to red, signaling a possible bearish reversal.
Soon after, a purple arrow appeared from the ADX Trend Reversal Alert Indicator.
This confirmed that selling pressure was building.
A sell trade was entered at the close of the signal candle.
The stop loss was placed above the recent swing high.
Price then declined steadily as the new downtrend developed.
The trade was closed when the indicators signaled a shift, locking in the majority of the move.
Download Now
FAQ
Does Trend Signals V2 repaint after a signal forms?
No. Once the colored line is printed after the candle closes, the signal remains fixed and does not change.
Can I adjust the sensitivity of the indicator?
Yes. Traders can modify calculation periods and visual parameters to match their trading style and risk tolerance.
Is Trend Signals V2 suitable for sideways markets?
The indicator performs best in trending environments. In ranging conditions, traders should combine it with additional confirmation tools.
Summary
The Trend Signals V2 indicator delivers actionable buy and sell signals based on real-time momentum analysis.
It keeps traders aligned with prevailing market direction and supports disciplined execution.
The color-based logic simplifies entries and exits while allowing flexibility through adjustable settings.
When applied during high-liquidity sessions and backed by a trade plan, it supports steady and repeatable intraday performance.


