
About the Guppy Trend indicator
The Guppy Forex indicator, also known as the Guppy Multiple Moving Average (GMMA), is a technical tool that identifies trend changes by analyzing two groups of moving averages.
It consists of short-term exponential moving averages (EMAs) and long-term EMAs to track the behavior of both traders and investors.
By observing the interaction between these groups, the indicator provides a clear visual of market sentiment and momentum strength.
When the two sets of moving averages expand, it suggests a strong trend is underway, whereas a compression indicates a potential reversal or consolidation.
It is a versatile tool for following price action across any currency pair, offering a simple, yet powerful way to stay aligned with the dominant market direction.
Free Download
Key Features
- The indicator utilizes two sets of EMAs to capture short-term and long-term price trends.
- Green and purple color EMA lines offer an immediate visual perspective on the current bias.
- Customizable settings include timeframe selection, price constants, and calculation methods.
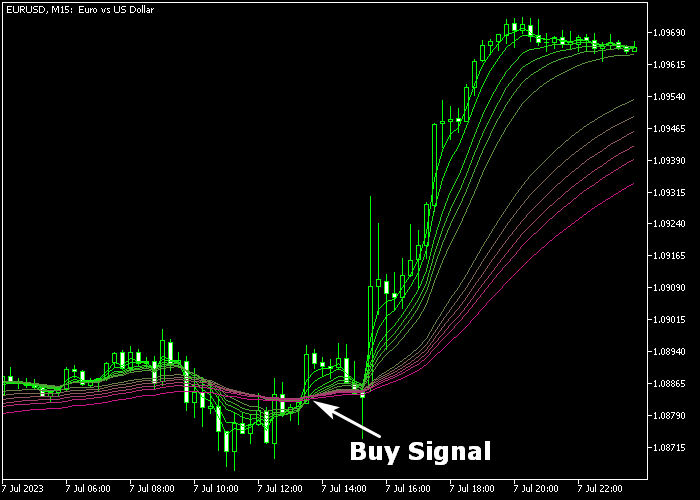
Indicator Chart
The chart shows the Guppy Trend indicator for MT5, featuring green short-term ribbons and purple long-term ribbons.
You can see how the crossover of these groups marks the beginning of new directional moves.
The expansion of the ribbons validates the strength of the current trend.
Guide to Trade with Guppy Trend Indicator
Buy Rules
- A buy signal is given when the green colored Guppy moving averages turn back above the purple colored MAs.
- Execute a long trade market order immediately once the bullish crossover is confirmed on the chart.
- Verify that the green ribbon is widening to ensure that buying momentum is increasing.
- Maintain the position as long as the green averages stay positioned above the purple group.
Sell Rules
- A sell signal is given when the green colored Guppy moving averages turn back below the purple colored MAs.
- Open a short market order as soon as the bearish crossover is established and clearly visible.
- Check that the price action remains below the purple long-term ribbon to confirm the downtrend.
- Keep the short trade active until the green averages start to cross back above the purple lines.
Stop Loss
- Set a protective stop loss below the most recent technical support level for all buy orders.
- Place your stop loss above the nearest technical resistance for any sell market positions.
- Using the outer edge of the purple ribbon can also serve as a logical point for stop placement.
- Adjust the stop to break-even once the trade moves significantly into profit to manage risk.
Take Profit
- Exit the buy position for a fixed pips profit target based on recent market volatility.
- Alternatively, close the trade and reverse the position when a magenta sell signal is displayed.
- For short trades, exit the market when the green MAs cross back above the purple group.
Guppy Forex Trend Scalping Strategy with TRIX Candle Keltner
This scalping strategy blends trend confirmation with precise entry timing for quick intraday moves.
The Guppy Forex Trend Indicator identifies bullish and bearish trends by tracking the interaction between green and purple moving averages.
When the green MAs move back above the purple MAs, it signals bullish strength, while a move below indicates bearish pressure.
The TRIX Candle Keltner Indicator provides precise entry points through colored candles.
Green candles confirm buying opportunities while red candles highlight sell setups, making it easier to time scalping entries in line with the trend.
This method works best on M1 and M5 charts and is suitable for traders targeting fast moves during high-volatility sessions such as London and New York.
Buy Entry Rules
- Wait for the green Guppy moving averages to move back above the purple MAs, confirming bullish trend resumption.
- Ensure that price respects the trend without immediate resistance overhead.
- Enter a buy trade when a green TRIX candle appears in alignment with the trend.
- Place the stop loss below the nearest minor swing low or under the purple Guppy line.
- Close the trade when a red TRIX candle forms or when the green Guppy averages start turning downward.
Sell Entry Rules
- Wait for the green Guppy moving averages to turn back below the purple MAs, confirming a bearish trend.
- Check that price is making lower highs and staying below the purple MAs.
- Enter a sell trade when a red TRIX candle appears in alignment with the trend.
- Place the stop loss above the recent swing high or above the purple Guppy line.
- Close the trade when a green TRIX candle appears or when the green Guppy averages begin moving up.
Case Study 1: EUR/GBP Buy Trade (M5)
During the London session, EUR/GBP showed a bullish resumption as the green Guppy moving averages crossed back above the purple lines.
Price pulled back slightly but remained above the moving averages, indicating trend stability.
When a green TRIX candle appeared, a buy trade was opened. The stop loss was placed under the recent swing low.
Price moved higher with small, controlled swings.
The long position was closed after a red candle formed, capturing a clean 25 pip scalping move within the session.
Case Study 2: USD/JPY Sell Trade (M1)
On the M1 chart, USD/JPY entered a bearish phase during the New York session.
The green Guppy MAs crossed back below the purple MAs, signaling the trend shift.
Price respected the downward bias while moving in short bursts.
A red TRIX candle appeared, confirming a sell setup. A sell trade was executed with a stop loss above the nearest swing high.
Price declined quickly in alignment with the trend.
The trade was exited when a green candle formed, securing a fast scalp with minimal risk.
Download Now
FAQ
What is the difference between the short and long-term ribbons?
The short-term ribbon represents the activity of speculative traders, while the long-term ribbon represents the sentiment of institutional investors.
Trend strength is highest when both groups move in the same direction.
Can I change the colors of the ribbons?
Yes, the starting and ending colors for both moving average groups can be modified in the settings.
This allows you to customize the indicator to fit your specific chart template and visibility needs.
Is this indicator effective for day trading?
Yes, it is widely used for day trading on M15 and H1 timeframes.
It helps traders stay with the intraday trend while avoiding the noise of small price fluctuations that occur within the ribbons.
Summary
The Guppy Trend indicator is a popular trend analysis tool offering reliable signals for buying and selling pairs in the Forex market.
By filtering out minor market noise, it helps traders focus on high-probability trend-following opportunities for better pip performance.
Overall, it is a robust and responsive tool for capturing significant directional moves across various assets.


