About the Heiken Ashi Candle Indicator
The Heiken Ashi Candle indicator for MT5 is a technical tool that modifies traditional price bars to create a smoother visual representation of market trends.
It uses a specific mathematical formula to average price data, which helps in identifying the core direction of a move while filtering out minor market noise.
By reducing the frequency of false signals, it allows traders to stay in winning positions longer and spot potential reversals with greater clarity.
This makes it an essential tool for those who prioritize trend-following strategies and want to avoid the distractions of volatile price spikes.
Free Download
heiken_ashi.mq5 Indicator (MT5)
Key Features
- The indicator applies a smoothing technique to price candles to highlight the dominant market trend.
- Blue and red color-coding provides an immediate visual assessment of current market pressure.
- Customizable inputs allow traders to modify the up and down candle colors to match their chart templates.
- It serves as an effective filter for identifying high-probability entry points in various trading sessions.
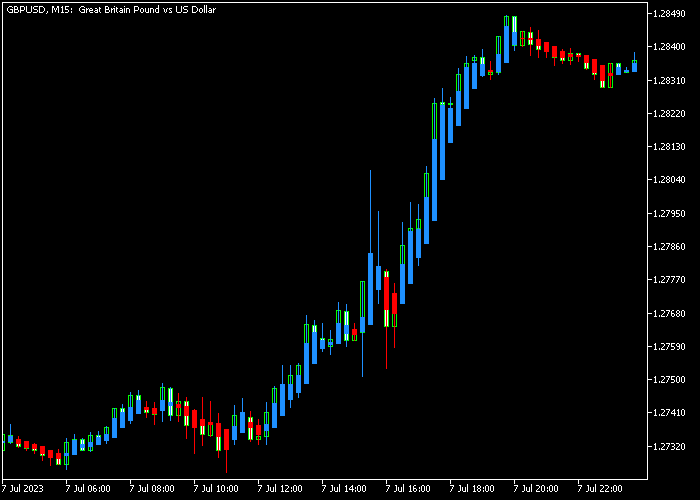
Indicator Chart
The chart shows the Heiken Ashi Candle indicator overlaying the price action with colored bars.
You can see how the blue candles represent a sustained upward move and the red candles mark a bearish decline.
The consistent color sequences help in identifying the strength and duration of a trend.

Guide to Trade with the Heiken Ashi Candle Indicator
Buy Rules
- A bullish signal is given when the blue colored Heiken Ashi candle gets printed on the chart.
- Ensure the overall market direction is upwards to align with the higher timeframe momentum.
- Execute a buy market order once the blue candle confirms a shift toward bullish pressure.
- Maintain the position as long as the candles remain blue and the trend shows no signs of weakening.
Sell Rules
- A bearish signal is given when the red colored Heiken Ashi candle gets printed on the chart.
- Verify that the overall market direction is downwards before initiating a short position.
- Execute a sell market order immediately following the appearance of a confirmed red candle.
- Keep the trade active while the red color sequence persists and the bearish bias is maintained.
Stop Loss
- Place a protective stop loss below the most recent swing low support for all buy trades.
- Set your stop loss above the most recent swing high resistance for sell market orders.
- Adjusting the stop to the bottom of the previous Heiken Ashi candle can act as a dynamic exit strategy.
Take Profit
- Close the buy position as soon as the first red colored Heiken Ashi candle appears on the chart.
- For short positions, exit the market when the first blue colored Heiken Ashi candle is printed.
- Targeting significant support and resistance levels is also an effective way to secure gains.
Heiken Ashi Candle Indicator MT5 Day Trading Strategy with Hull MA
This day trading strategy focuses on clean trend identification and smooth entries by combining two powerful tools.
The Heiken Ashi Candle Indicator simplifies price action by filtering out market noise and highlighting clear bullish and bearish momentum through colored candles.
This makes it easier to stay in trades without reacting to small fluctuations.
The Hull Moving Average Indicator complements this by providing a fast and responsive trend line.
It reacts quickly to price changes while maintaining a smooth structure, helping traders confirm the overall direction with less lag compared to traditional moving averages.
This combination works well on M15 and M30 timeframes and is ideal for traders who want to follow strong intraday trends on major currency pairs.
Buy Entry Rules
- Wait for the Hull Moving Average to turn green, confirming an upward trend.
- Check that price remains above the Hull line to maintain a bullish structure.
- Look for consecutive blue Heiken Ashi candles showing steady buying pressure.
- Enter a buy trade after a small pullback followed by a new blue candle.
- Place the stop loss below the most recent swing low.
- Close the trade when a red Heiken Ashi candle appears or when the Hull turns red.
Sell Entry Rules
- Wait for the Hull Moving Average to turn red, confirming a bearish trend.
- Ensure price stays below the Hull line to validate downside momentum.
- Look for consecutive red Heiken Ashi candles indicating strong selling pressure.
- Enter a sell trade after a minor retracement followed by a new red candle.
- Place the stop loss above the recent swing high.
- Close the trade when a blue Heiken Ashi candle appears or when the Hull turns green.
Case Study 1: EUR/JPY Buy Trade
During the London session, EUR/JPY showed a steady upward trend on the M15 timeframe.
The Hull Moving Average turned green and price stayed consistently above it.
The Heiken Ashi candles remained blue, confirming sustained bullish momentum.
After a brief pullback, a new blue candle formed, signaling continuation.
A buy trade was opened at the next candle. The stop loss was placed below the recent swing low.
Price continued rising in a smooth trend.
The trade was closed when a red candle appeared, securing a solid 50 pip intraday profit.
Case Study 2: NZD/USD Sell Trade
On the M30 timeframe, NZD/USD entered a clear downtrend during the New York session.
The Hull Moving Average turned red and price stayed below it.
The Heiken Ashi candles consistently printed red, confirming bearish pressure.
Following a small retracement, a fresh red candle appeared, providing a sell entry.
The stop loss was placed above the recent high. Price declined steadily with strong momentum.
The position was closed when a blue candle formed, capturing a clean move within the session.
Download Now
heiken_ashi.mq5 Indicator (MT5)
FAQ
How is Heiken Ashi different from standard candles?
Heiken Ashi candles use averaged price data to smooth out fluctuations.
This makes the trend much easier to see compared to standard candles, which only show the open, high, low, and close.
Can I use this indicator for scalping?
Yes, it is very effective for scalping on M1 or M5 charts.
It helps you stay in a trade through minor pullbacks that might otherwise look like a trend reversal on a standard chart.
Summary
The Heiken Ashi candle indicator is a popular trend analysis tool offering reliable signals for buying and selling pairs in the Forex market.
It smooths out price action to provide a clearer view of momentum and market direction.
Using color-coded bars simplifies the decision-making process for traders of all experience levels.
Overall, it is a robust tool for reducing false signals and identifying the path of least resistance in trending markets.


